Skip to product information
1 of 8

PayPal, credit cards. Download editable-PDF and invoice in 1 second!

HJ 633-2012 English PDF (HJ633-2012)

HJ 633-2012 English PDF (HJ633-2012)

Regular price $130.00 USD
Regular price Sale price $130.00 USD
Sale Sold out
Shipping calculated at checkout.
Delivery: 3 seconds. Download true-PDF + Invoice.
Get Quotation: Click HJ 633-2012 (Self-service in 1-minute)
Historical versions (Master-website): HJ 633-2012
Preview True-PDF (Reload/Scroll-down if blank)

HJ 633-2012: Technical Regulation on Ambient Air Quality Index (on trial)
HJ 633-2012
Technical Regulation on Ambient Air Quality Index (on trial)
People's Republic of China National Environmental Protection Standards
Ambient Air Quality Index (AQI) technical requirements
(Trial)
Issued on.2012-02-29
2016-01-01 implementation
Issued by the Ministry of Environmental Protection
annex.
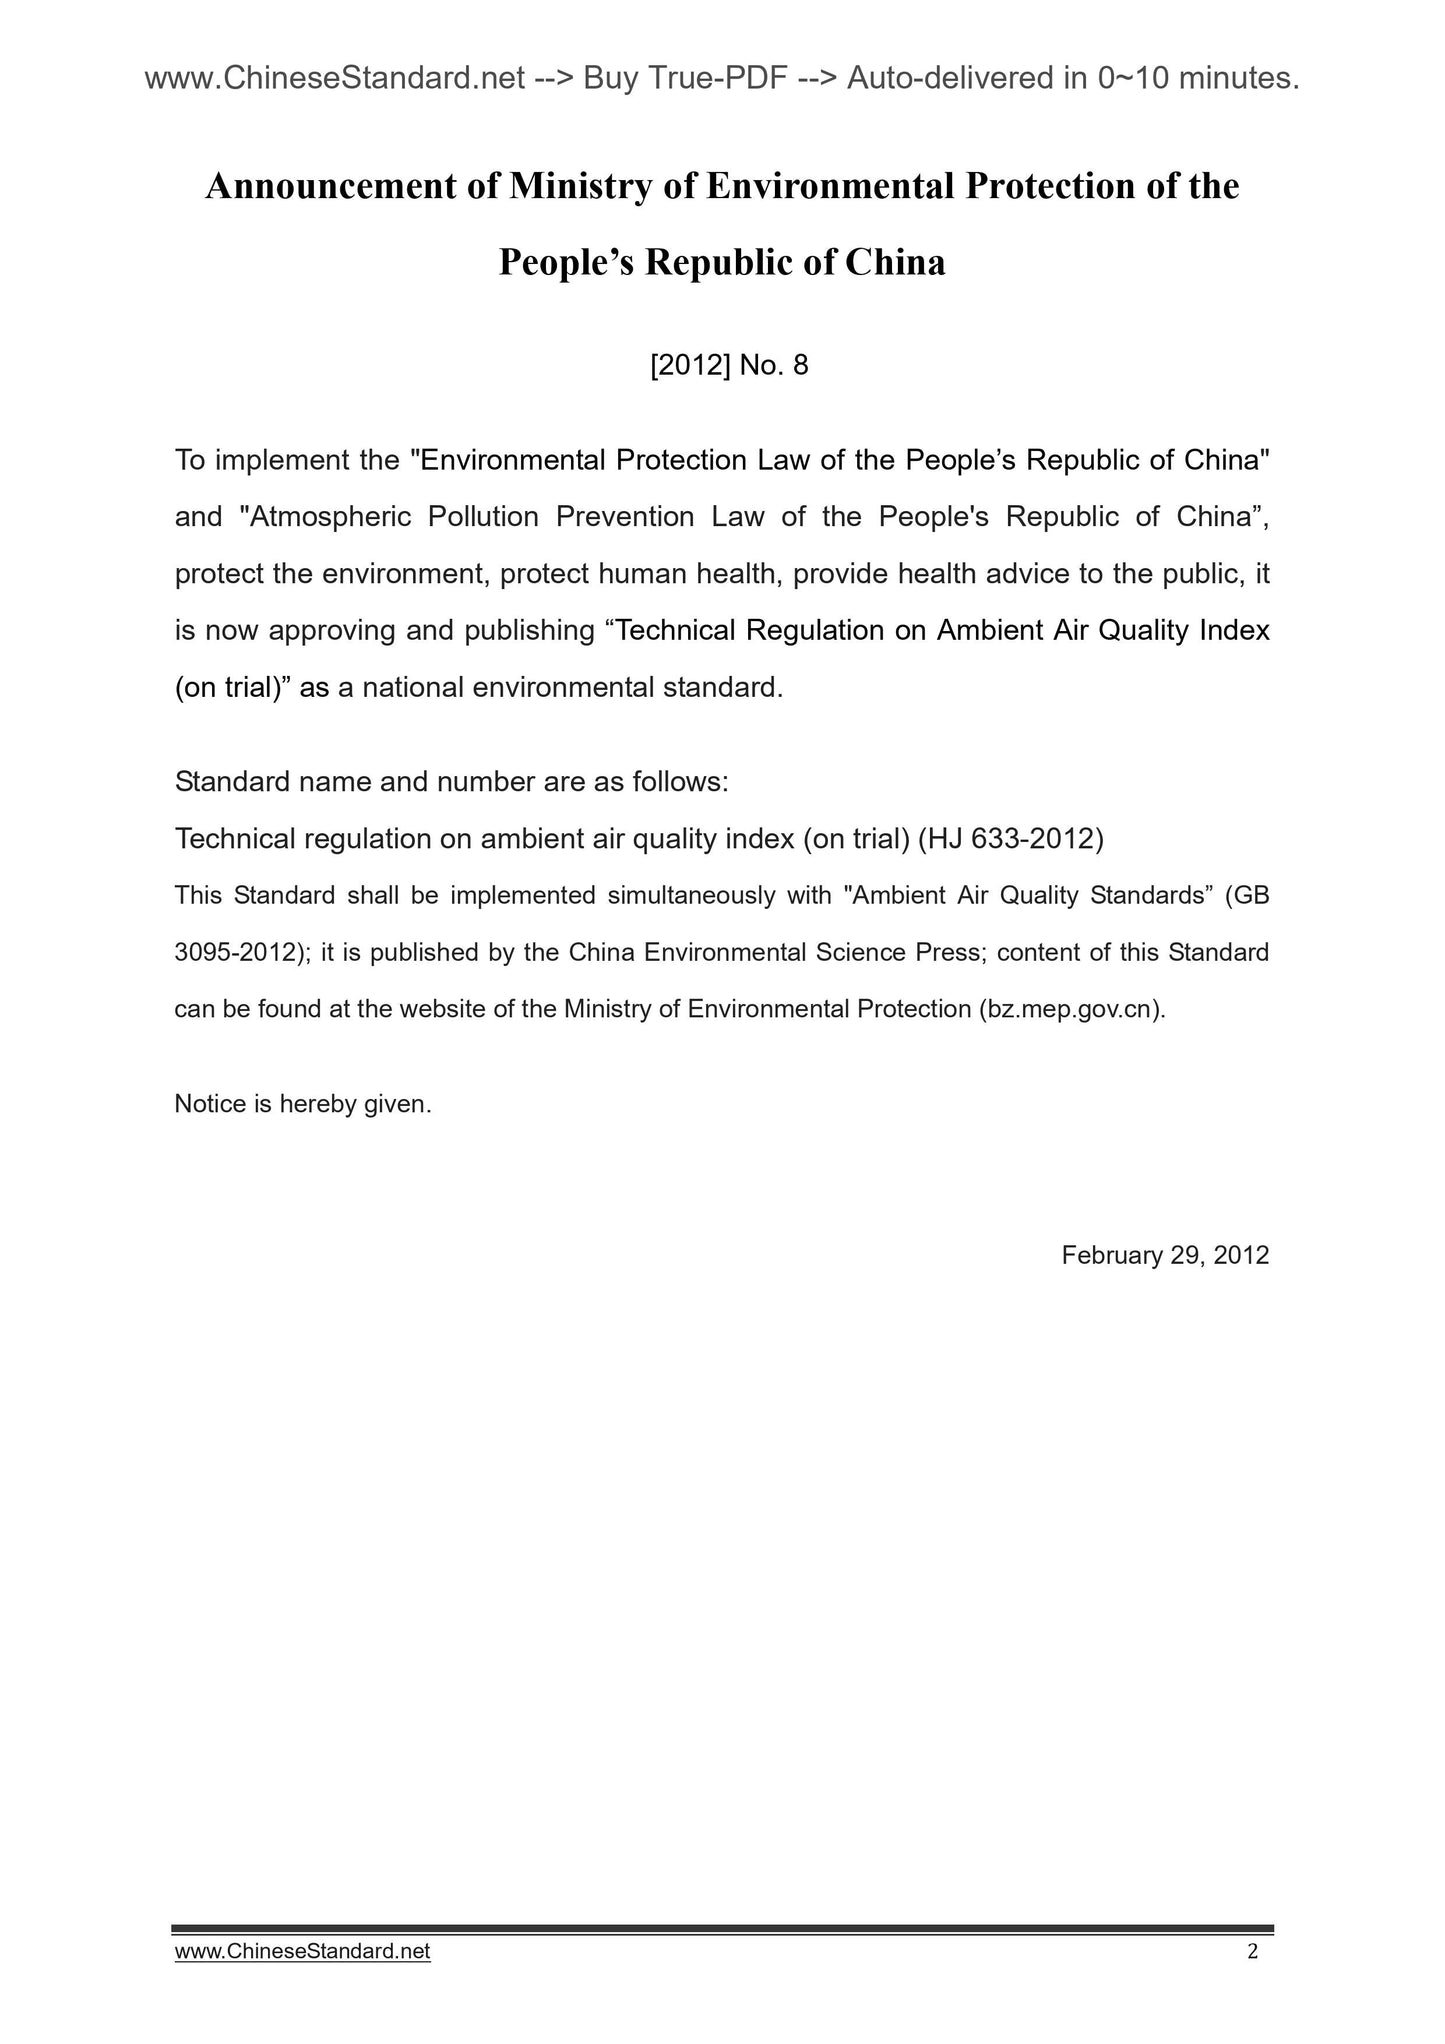
People's Republic of China Ministry of Environmental Protection
announcement
2012, No. 8
To implement the "People's Republic of China Environmental Protection Law" and "People's Republic of China Air Pollution Prevention Law" to protect the environment, protect the people
Body health, health advice to the public, are now approved "Ambient Air Quality Index (AQI) technical requirements (Trial)" for the national environmental protection
Protection standards and to publish.
Standard name, numbered as follows.
This standard and the "Ambient Air Quality Standards" (GB 3095-2012) be implemented simultaneously, published by the China Environmental Science Press, standard
Special announcement.
February 29, 2012
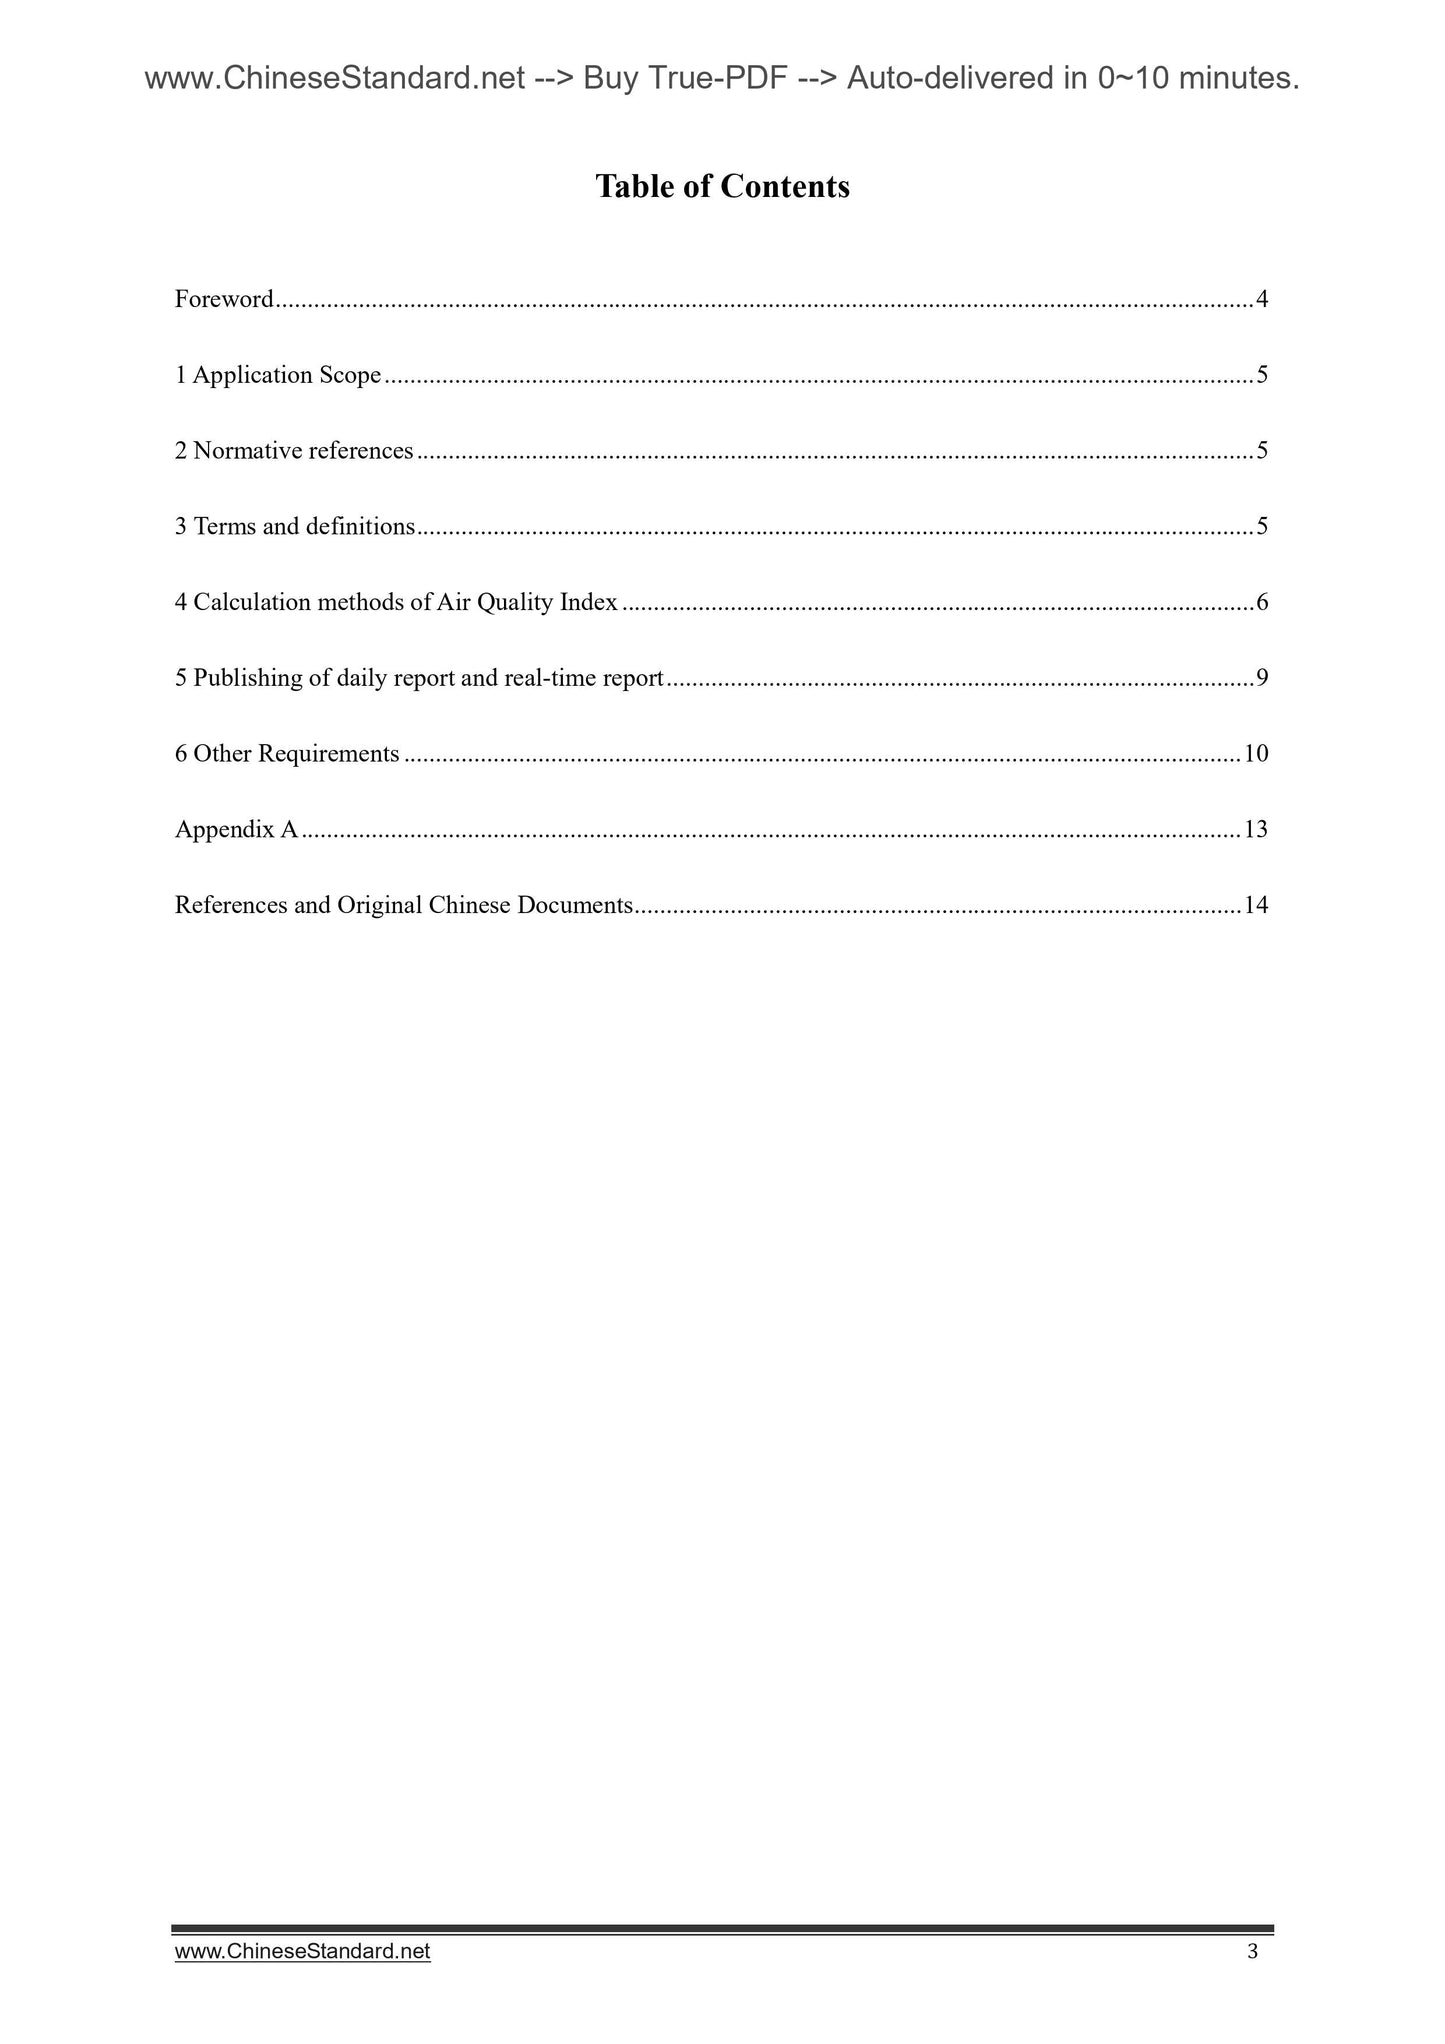
Table of Contents
Preface ..iii
1. Scope ..1
2 Normative references ..1
3 Terms and Definitions .1
4 Air Quality Index calculation methods ..1
5 reported daily and real-time release 3
6 Other requirements ..4
Appendix A (normative) air quality index showing color category .6
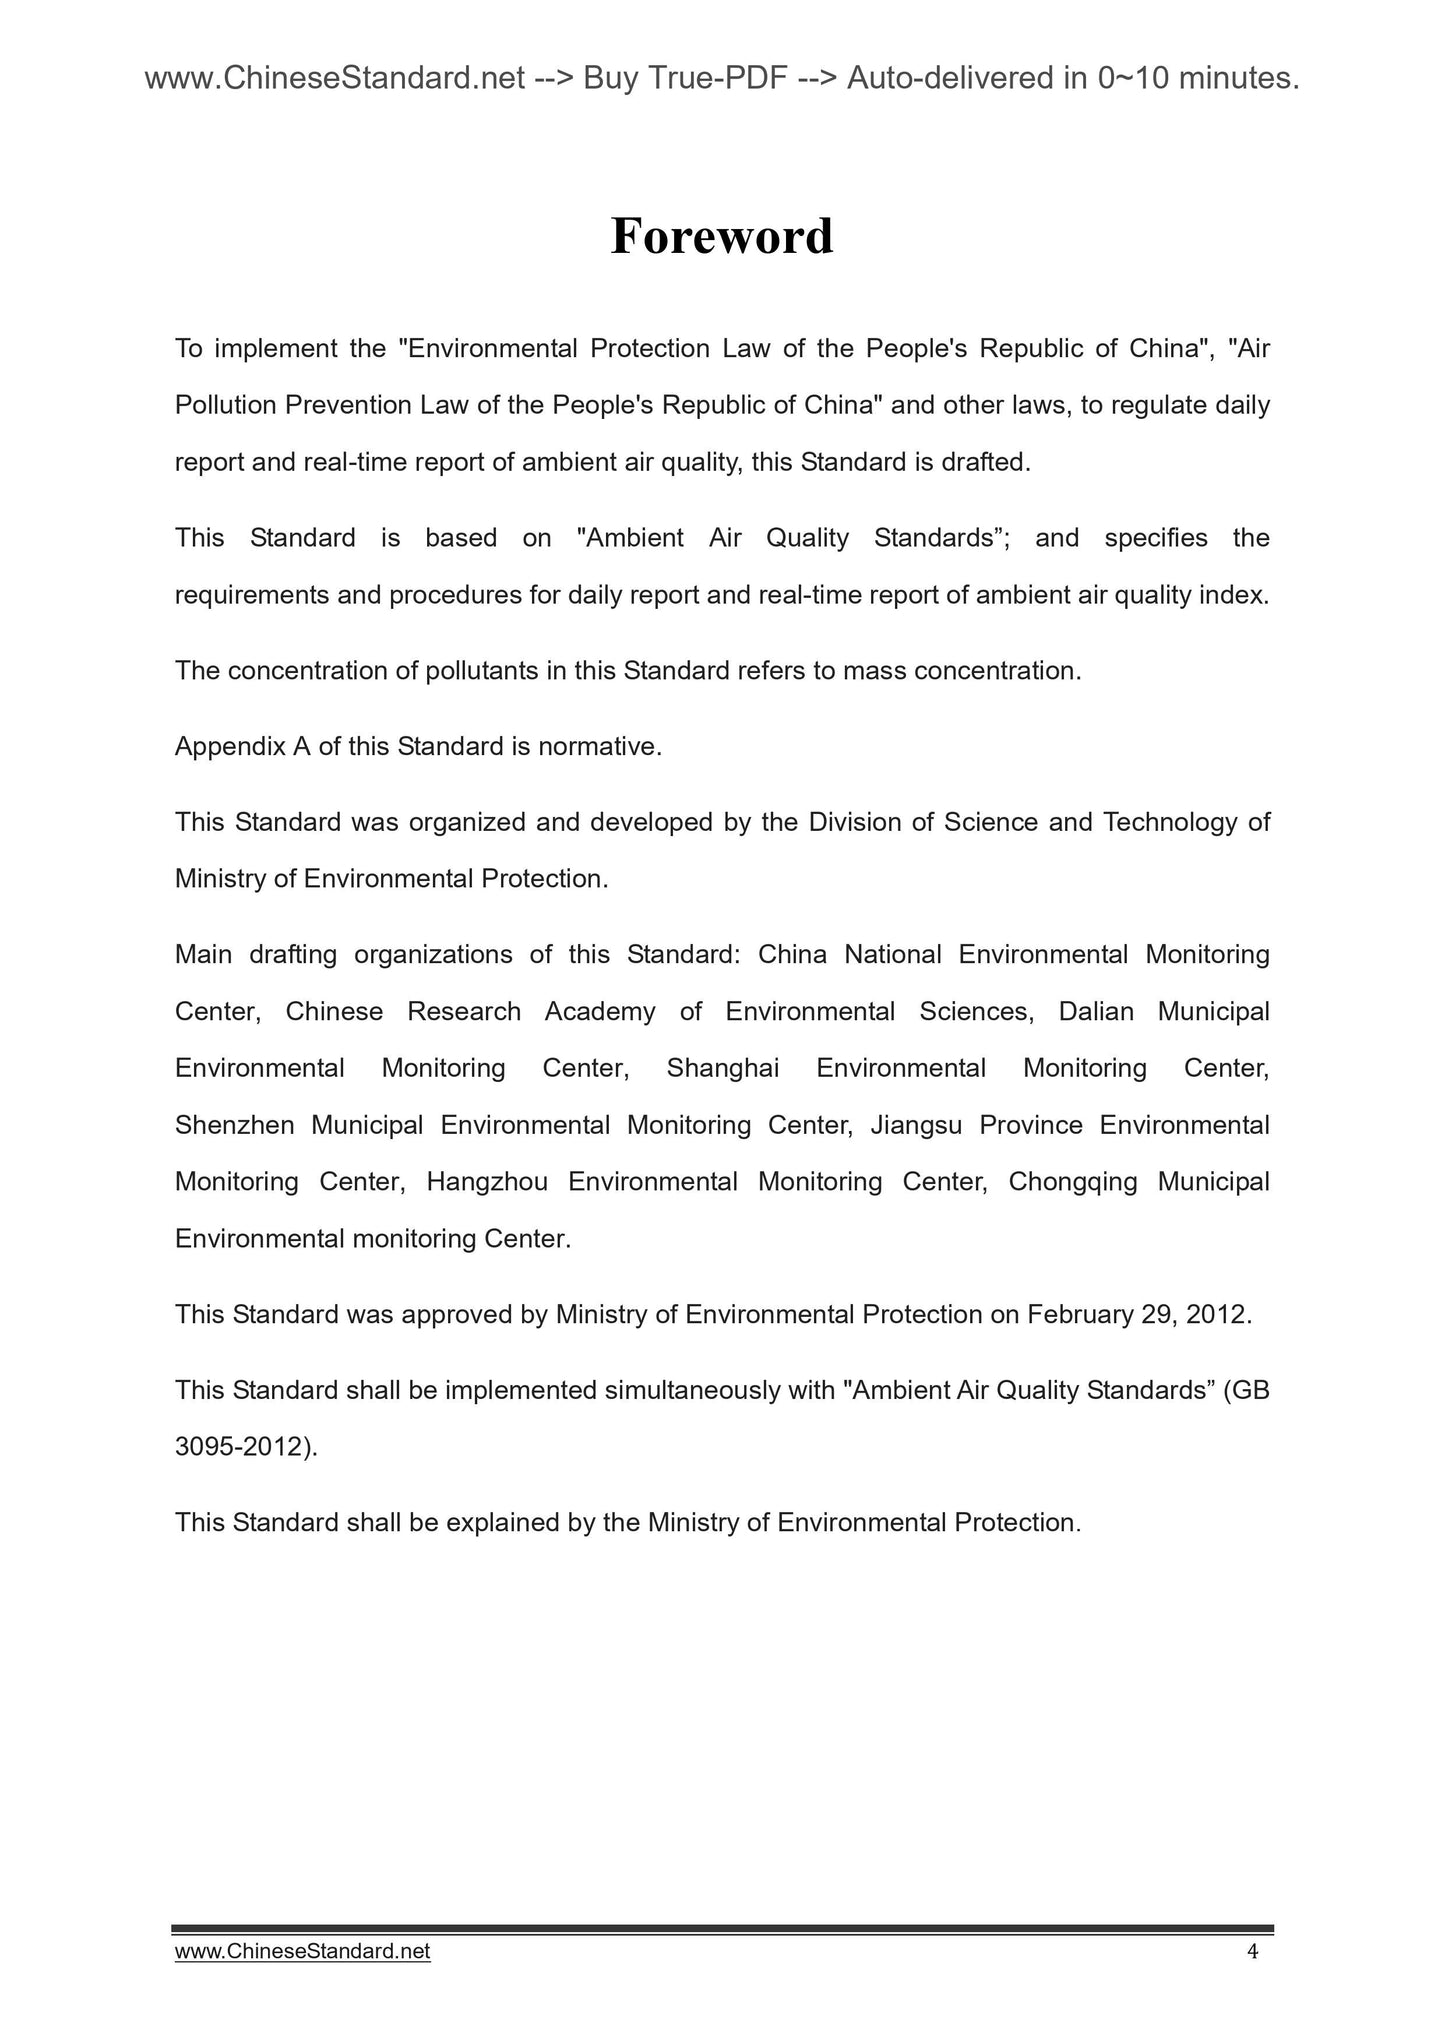
Foreword
To implement the "People's Republic of China Environmental Protection Law", "People's Republic of China Air Pollution Prevention Law" and other laws, regulations, ambient air
Mass index daily and real-time reports on the development of this standard.
This standard is based on "Ambient Air Quality Standards", specifies the requirements and procedures for ambient air quality index and real-time daily newspaper job.
The concentration of pollutants in this standard are mass concentration.
Appendix A of this standard is a normative appendix.
This standard is developed by the Ministry of Environmental Protection Science, Technology organization.
This standard is mainly drafted by. China National Environmental Monitoring Center, Chinese Research Academy of Environmental Sciences, Dalian Municipal Environmental Monitoring Center, Shanghai Central
Environmental monitoring center, the Shenzhen Municipal Environmental Monitoring Center, Jiangsu Provincial Environment Monitoring Center, Hangzhou Environmental Monitoring Center, Chongqing Municipal Environmental Monitoring
center.
This standard MEP February 29, 2012 for approval.
This standard and the "Ambient Air Quality Standards" (GB 3095-2012) be implemented simultaneously.
The standard explanation by the Ministry of Environmental Protection.
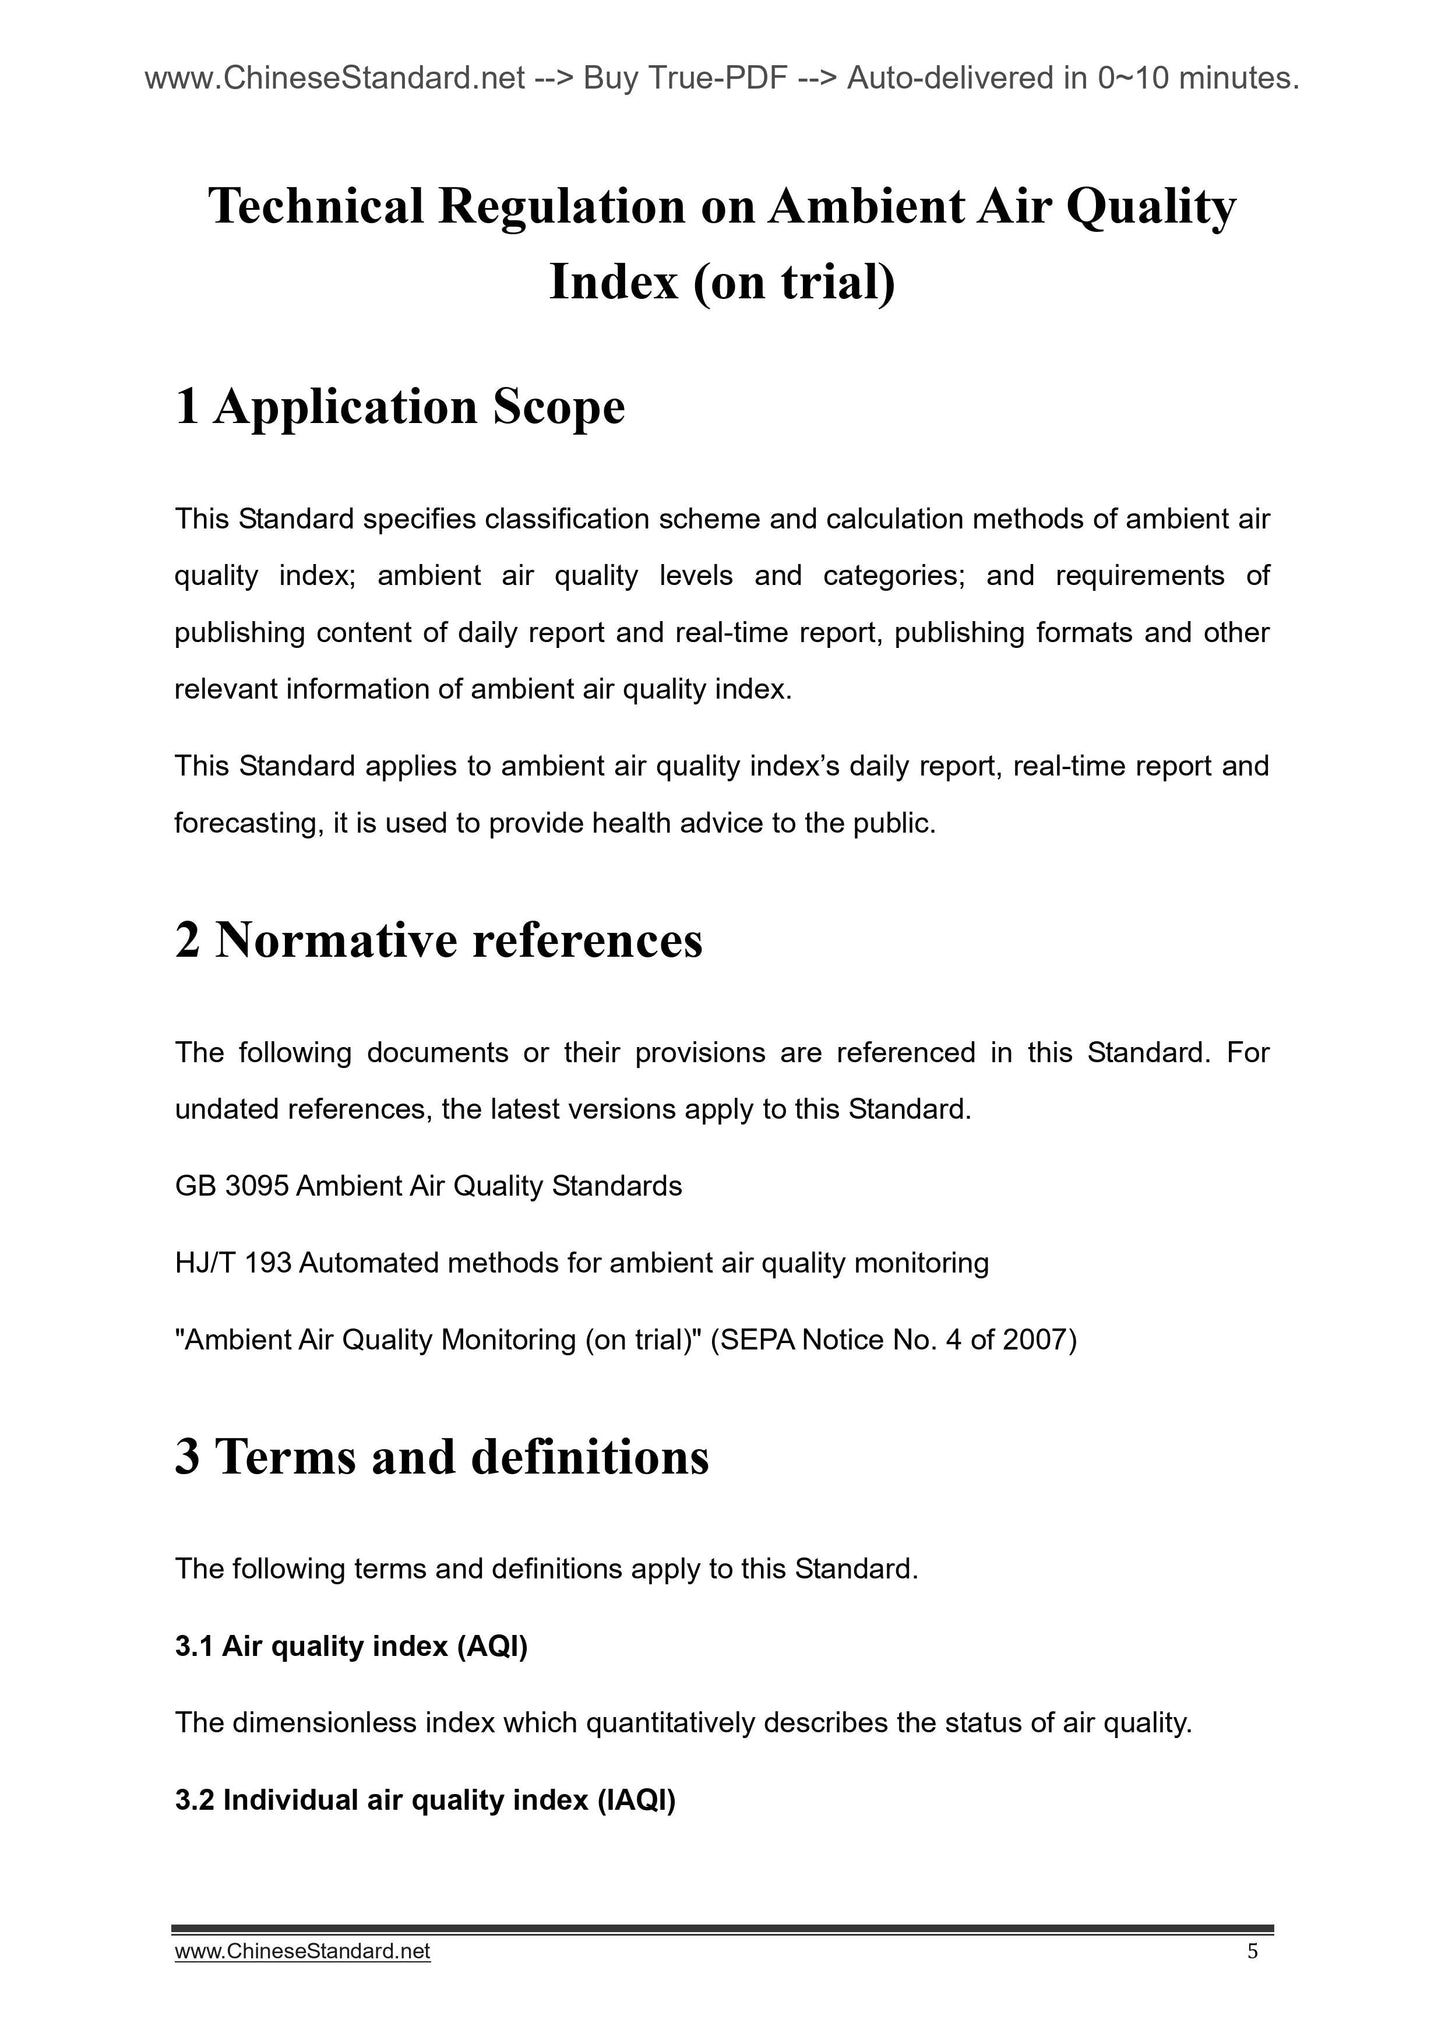
Ambient Air Quality Index (AQI) technical requirements (Trial)
1 Scope
This standard specifies the classification scheme of ambient air quality index, calculated and ambient air quality levels and categories, as well as air quality
Publish content index and real-time daily newspaper, publishing formats and other related requirements.
This standard applies to ambient air quality index daily, real-time reporting and forecasting to provide health advice to the public.
2 Normative references
This standard references the following documents or the terms. For undated reference documents, the latest versions apply to this standard.
GB 3095 Ambient Air Quality Standard
HJ/T 193 automatic ambient air quality monitoring technical specifications
"Ambient air quality monitoring standards (Trial)" (SEPA Announcement [2007] No. 4)
3 Terms and Definitions
The following terms and definitions apply to this standard.
3.1
AQI air quality index (AQI)
Quantitative description of the air quality status of dimensionless index.
3.2
Air quality sub-index individual air quality index (IAQI)
Individual pollutant air quality index.
3.3
Primary pollutant primary pollutant
AQI is greater than 50 IAQI biggest air pollutants.
3.4
Excessive pollutants non-attainment pollutant
Concentrations exceed the national ambient air quality standards for pollutants that IAQI more than 100 contaminants.
4 Air Quality Index calculation methods
Air Quality Index 4.1 points classification scheme
Air quality and the corresponding sub-index level of pollutant concentration limits in Table 1 project.
Table 1 and the corresponding sub-indices of air quality pollutant concentration limits project
air quality
Subindex
(IAQI)
Pollutant concentration limits project
Sulfur dioxide
(SO2)
24 hours
average/
(Μg/m3)
Sulfur dioxide
(SO2)
1 hour
average/
(Μg/m3) (1)
Nitrogen dioxide
(NO2)
24 hours
average/
(Μg/m3)
Nitrogen dioxide
(NO2)
1 hour
average/
(Μg/m3) (1)
particulates
(Small particle size
Than or equal
10μm)
24 hours
average/
(Μg/m3)
Carbon monoxide
(CO)
24 hours
average/
(Mg/m3)
Carbon monoxide
(CO)
1 hour
average/
(Mg/m3) (1)
Ozone (O3)
1 hour
average/
(Μg/m3)
Ozone (O3)
8 hours slip
Moving average /
(Μg/m3)
particulates
(Small particle size
Than or equal
2.5μm)
24 hours
average/
(Μg/m3)
00000000000
5,050,150,401,005,025,160 100 35
100 150 500 8,020,015,041,020,016,075
150 475 650 180 7,002,501,435,300,215,115
200 800 800 280 1 2,003,502,460,400,265,150
3001600 (2) 565 2 3,404,203,690,800,800,250
4002100 (2) 7,503,090,500,481,201,000 (3) 350
5002620 (2) 9,403,840,600,601,501,200 (3) 500
Explanation.
(1) sulfur dioxide (SO2), nitrogen dioxide (NO2) and carbon monoxide (CO) of 1-hour average concentration limits only for real-time reported in the daily newspaper
Pollutants need to use the appropriate 24-hour average concentration limits.
(2) sulfur dioxide (SO2) 1-hour average concentration higher than 800 μg/m3, and no longer conduct its air quality index calculation points, sulfur dioxide (SO2)
Air quality sub-index sub-index report by the 24-hour average concentration calculation.
(3) 8-hour average concentration of ozone (O3) is higher than 800 μg/m3, and no longer conduct its air quality index calculation points, ozone (O3) air quality
Sub-index sub-index of 1-hour average concentration calculation report.
4.2 Air Quality Index calculation methods stars
Project P pollutants air quality sub-indices according to formula (1).
HL
PPLL
HL
IAQI IAQI
IAQI (BP) IAQI
BP BP
io
oo
io
C- = - - (1)
Where. PIAQI - Pollutants Project P sub-index of air quality;
PC - mass concentration of pollutants in the project P values;
HBP i - table high pollutant concentration limit values 1 and PC similar;
LBP o - meter low pollutant concentration limit values 1 and PC similar;
HIAQI i - Table 1 and HBP i corresponding air quality sub-indices;
LIAQI o - Table 1 and LBP o corresponding air quality sub-indices.
4.3 Air Quality Index levels
Air Quality Index levels are divided according to the provisions of Table 2.
Table 2 Air Quality Index and related information
air quality
index
air quality
Index Level
Air Quality Index and category
Measures taken by the color of the recommendations on health
0-50 an excellent green air quality is satisfactory, almost no air pollution, normal activities can be all kinds of people
51 to 100 two good yellow
Air quality is acceptable, but some contaminants
Can very small number of extremely sensitive population health
Weaker influence
Very few unusually sensitive people should reduce outdoor
activity
101 to 150 three light pollution orange susceptible mild symptoms intensified, irritation occur in healthy people
Children, the elderly and heart disease, respiratory system
Patients with the disease should be reduced for a long time, high intensity
Outdoor exercise
151 to 200 four moderately polluted red further aggravate the symptoms of the susceptible population, it may be heart healthy population, affecting the respiratory system
Children, the elderly and heart disease, respiratory system
Illness to avoid prolonged, high-intensity households
Outside exercise, a moderate reduction in the general population outdoor operation
201 to 300 five heavily polluted purple
Symptoms of heart disease and lung disease was significantly increased,
Decreased exercise tolerance, general health of the population
Now symptoms
Children, the elderly and heart disease, lung disease
Should stay indoors, stop outdoor sports, a
The general population to reduce outdoor sports
> 300 six serious pollution maroon healthy population decreased exercise tolerance, there are obvious strong symptoms, in advance of certain diseases
Children, the elderly and the sick should stay in the room
Inside, avoid physical exertion, the general population should be avoided
Free outdoor activities
4.4 Determination of the air quality index and primary pollutants
4.4.1 Air Quality Index calculation methods
Air Quality Index by the formula (2).
{} 1 2 3AQI max IAQI, IAQI, IAQI,, IAQIn = "(2)
Where. IAQI - Air quality sub-indices;
n-- pollutant projects.
4.4.2 Determination of primary pollutants and excessive pollutants
When the AQI is greater than 50, IAQI maximum contaminant primary pollutants. If IAQI biggest pollutant is two or more,
Parallel primary pollutants.
IAQI pollutants greater than 100 is excessive pollutants.
5 daily and real-time newspaper publisher
5.1 publish content
5.1.1 publish content air quality monitoring sites reported daily and real-time evaluation, including monitoring position, and the concentration of air pollutants each
Air quality sub-indices, the air quality index, the primary pollutants and air quality levels, when the report describes the monitoring indicators and the lack of indicators. Daily and
Real-time reported by the prefecture-level administrative department of environmental protection (including ground level) or its authorized environmental monitoring station release.
5.1.2 The time period of 24 hours daily for a duration of 24 hours prior to the day zero. Daily indicators include sulfur dioxide (SO2), carbon
Nitrogen (NO2), particulate matter (particle diameter less than or equal 10μm), particulate matter (particle diameter less than or equal 2.5μm), carbon monoxide (CO) 24
Hour average, and ozone (O3) the average daily maximum 1 hour ozone (O3) of the daily maximum 8 hours moving average, a total of seven means
Mark.
5.1.3 Real Time time period of 1 hour, you can publish all monitoring sites in real time after each message the whole point of time, the lag time should not exceed 1
hour. Real Time indicators include sulfur dioxide (SO2), nitrogen dioxide (NO2), ozone (O3), carbon monoxide (CO), particulate matter (particle
Diameter less than or equal 10μm) and particulate matter (particle size less than or equal 2.5μm) 1-hour average, and ozone (O3) 8 Xiaoshi Moving Average
And particulate matter (particle size less than or equal 10μm), particulate matter (particle size less than or equal 2.5μm) 24-hour moving average, a total of nine indicators.
5.1.4 When calculated for each monitoring site air quality index, sub-indices of the pollutant air quality and air quality index using the point
Concentration of the pollutant, concentration limits in Table 1, the formula (1) and (2) is calculated.
5.1.5 daily and real-time data reported by the daily air quality index preliminary audit software system, real-time data only daily newspaper and the day of Senate
Reference value, should be early next month on month data will be revised based on complete audit and verification procedures.
5.2 publish data format
5.2.1 Air Quality Index daily data format shall conform to the requirements of Table 3.
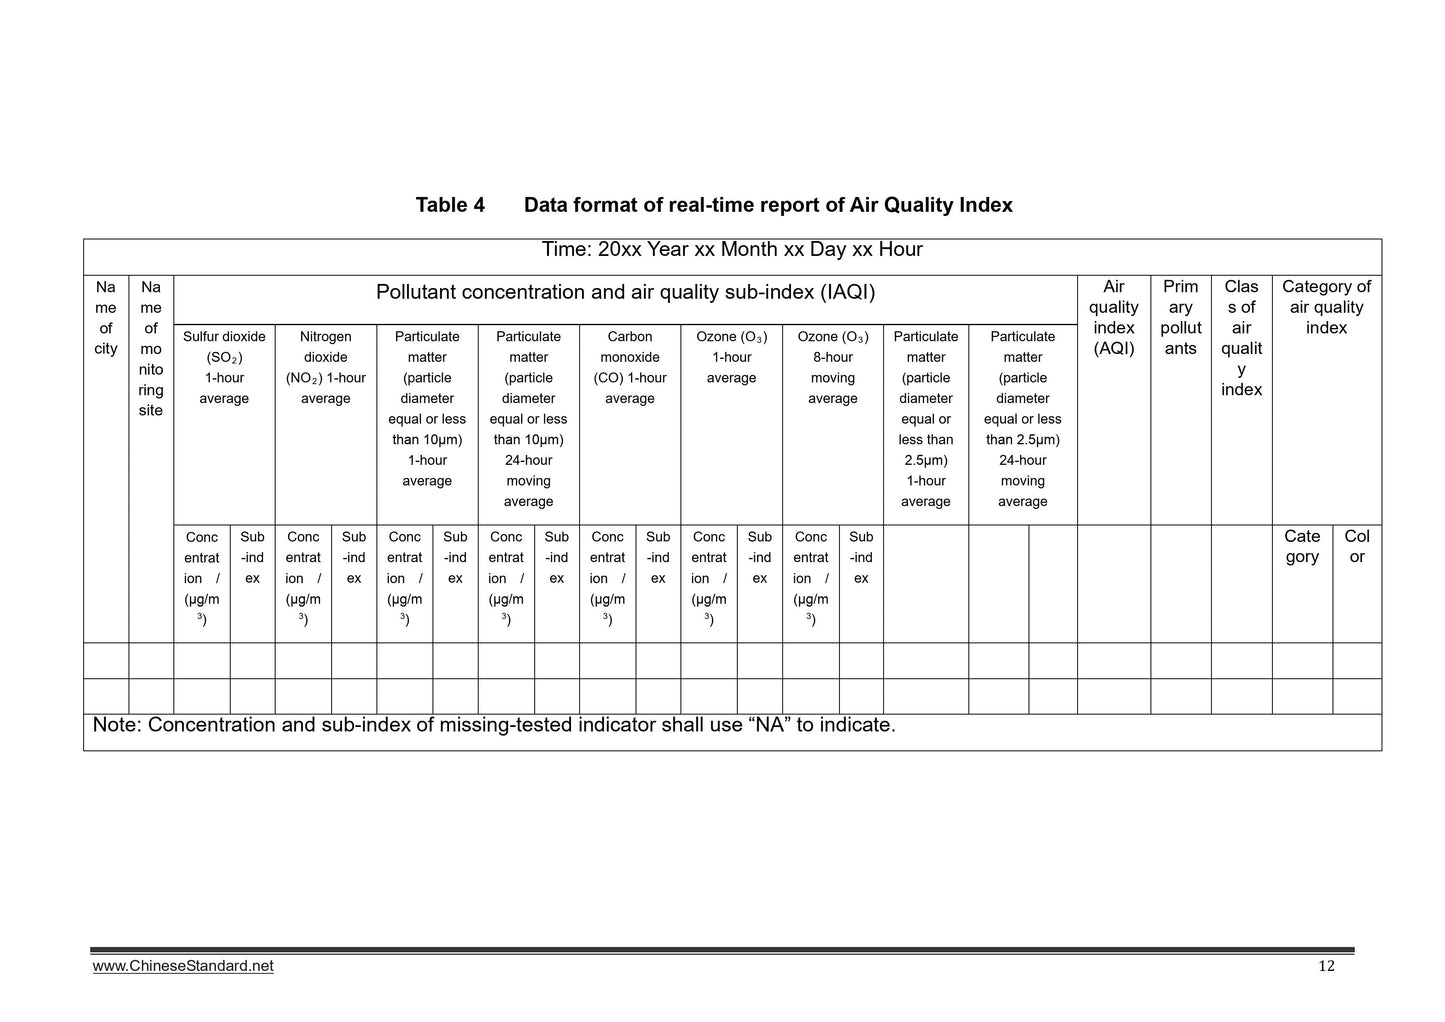
5.2.2 Real-time air quality index data formats shall be reported in Table 4 requirements.
6 Other requirements
6.1 monitoring sites ambient air quality monitoring and evaluation involves layout and adjustment, set the frequency of monitoring, statistics and monitoring data
Treatment by "ambient air quality monitoring standards (Trial)" and the requirements of HJ/T 193 and other relevant standards and other regulatory documents execution.
6.2 Ambient Air Quality Air Quality Index and sub-index calculations should all carry rounded, no decimals.
6.3 GB 3095-2012 standard and simultaneous use.
6.4 Evaluation of ambient air quality compliance status should be carried out in accordance with the provisions of GB 3095.
Table 3 Daily air quality index data format
Time. 20 □□ years □□ month □□ day
city
name
monitor
Points
name
The concentration of pollutants and air quality sub-index (IAQI)
Air quality
Volume index
(AQI)
Primary
Pollution
Air quality
Volume index
level
air quality
Index category of sulfur dioxide
(SO2)
24-hour average
Nitrogen dioxide
(NO2)
24-hour average
particulates
(Particle size less than or equal
10μm)
24-hour average
Carbon monoxide
(CO)
24-hour average
Ozone (O3)
Up to 1 hour average
Ozone (O3)
Maximum 8 hours moving average
particulates
(Particle size less than or equal
2.5μm)
24-hour average color category
concentration/
(Μg/m3) sub-index
concentration/
(Μg/m3) sub-index
concentration/
(Μg/m3) sub-index
concentration/
(Mg/m3) sub-index
concentration/
(Μg/m3) sub-index
concentration/
(Μg/m3) sub-index
concentration/
(Μg/m3) sub-index
NOTE. lack of concentration and measurable indicators of sub-indices were identified using NA.
Table 4. Real-time air quality index data packet format
Time. 20 □□ years □□ □□ month □□ day when
city
name
monitor
Points
name
The concentration of pollutants and air quality sub-index (IAQI)
Air quality
Volume index
(AQI)
Primary
Pollution
air
quality
index
level
air quality
Index category of sulfur dioxide
(SO2)
1 hour average
Nitrogen dioxide
(NO2)
1 hour average
Particulate Matter (tablets
Diameter less than or equal
To 10μm)
1 hour average
particulates...
View full details