Skip to product information
1 of 10

PayPal, credit cards. Download editable-PDF and invoice in 1 second!

GB/T 6113.101-2016 English PDF (GBT6113.101-2016)

GB/T 6113.101-2016 English PDF (GBT6113.101-2016)

Regular price $370.00 USD
Regular price Sale price $370.00 USD
Sale Sold out
Shipping calculated at checkout.
Delivery: 3 seconds. Download true-PDF + Invoice.
Get QUOTATION in 1-minute: Click GB/T 6113.101-2016
Historical versions: GB/T 6113.101-2016
Preview True-PDF (Reload/Scroll if blank)

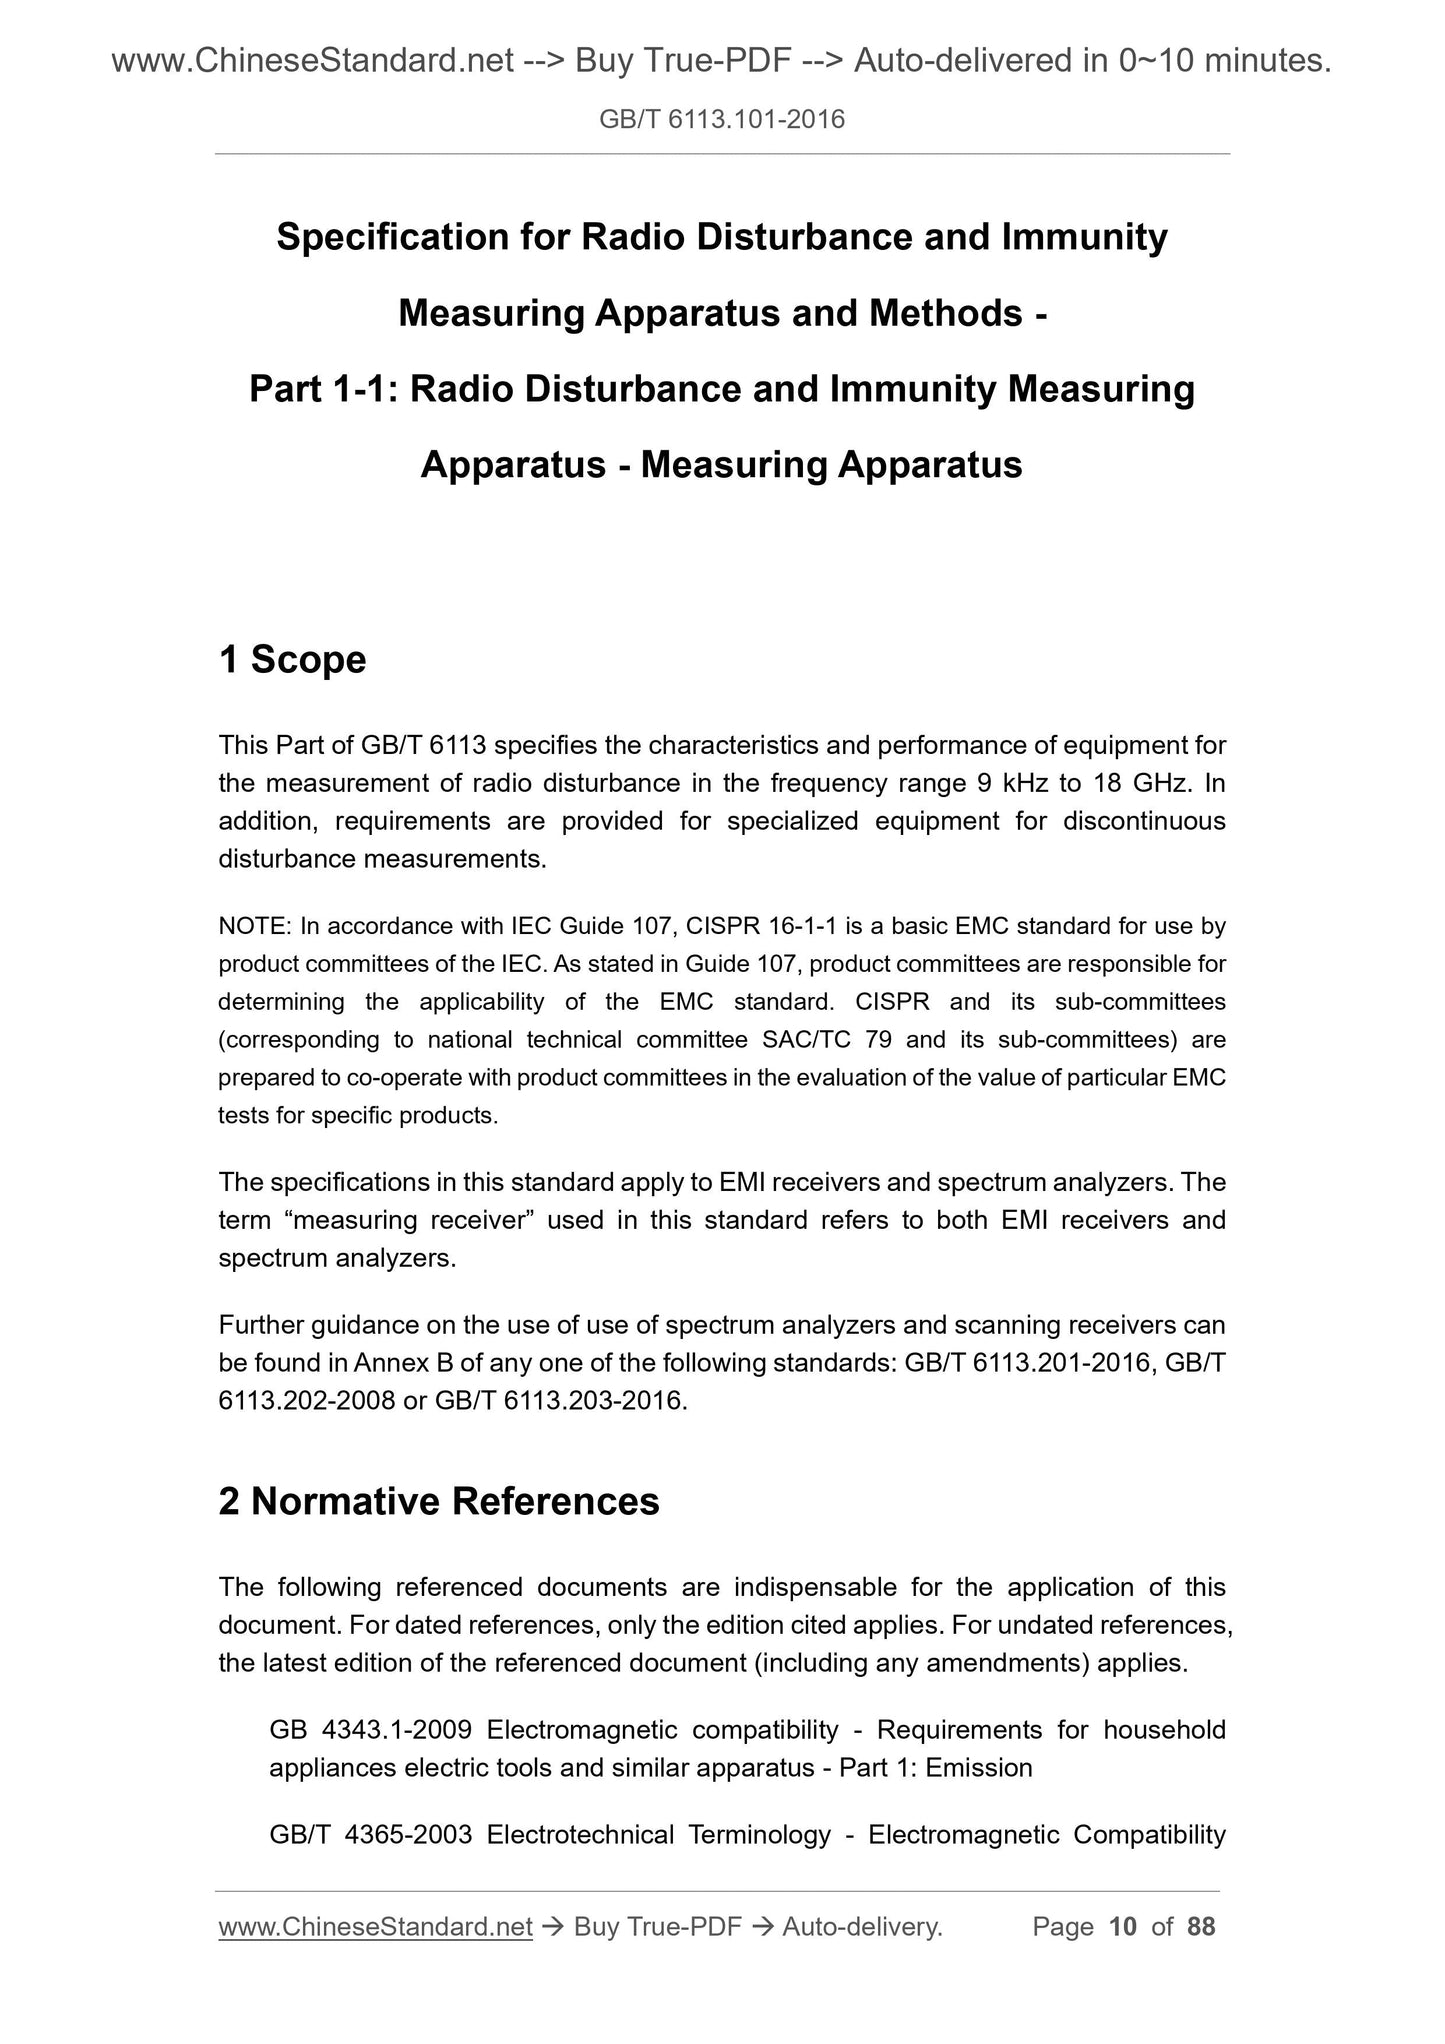
GB/T 6113.101-2016: Specification for radio disturbance and immunity measuring apparatus and methods -- Part 1-1: Radio disturbance and immunity measuring apparatus -- Measuring apparatus
GB/T 6113.101-2016
Specification for radio disturbance and immunity measuring apparatus and methods. Part 1-1. Radio disturbance and immunity measuring apparatus.Measuring apparatus
ICS 33.100
L06
National Standards of People's Republic of China
Replace GB/T 6113.101-2008
Radio disturbance and immunity measurement equipment and measurements
Method Specification Part 1-1. Radio Harassment and
Immunity measurement equipment measuring equipment
measuringapparatusandmethods-Part 1-1.Radiodisturbanceand
(CISPR16-1-1..2010, IDT)
2016-04-25 released.2016-11-01 implementation
General Administration of Quality Supervision, Inspection and Quarantine of the People's Republic of China
China National Standardization Administration issued
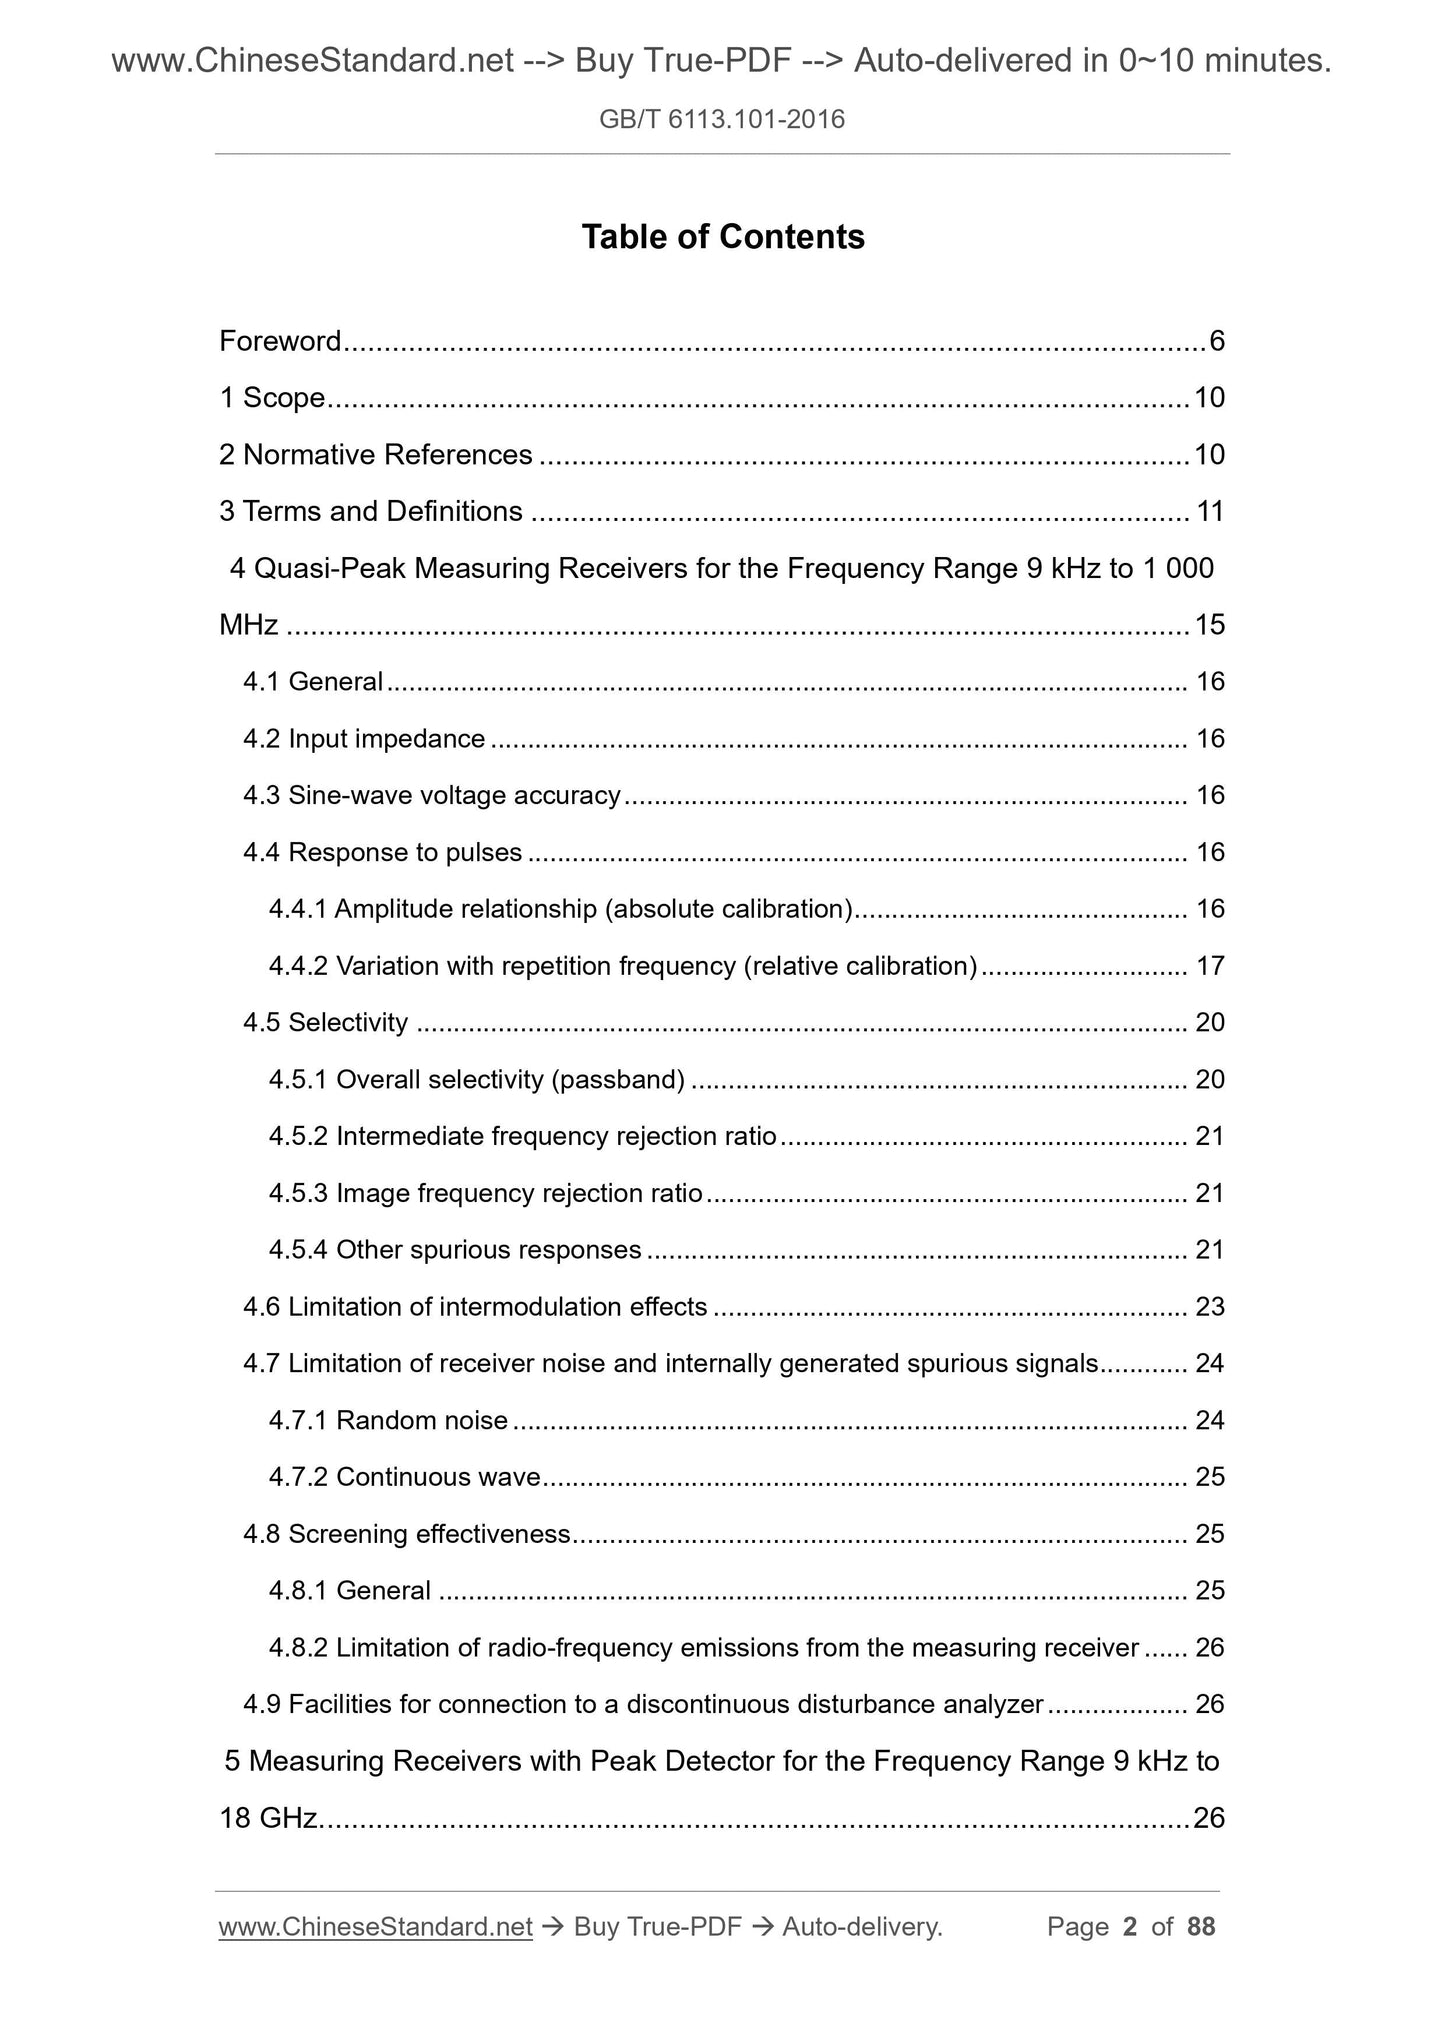
Content
Foreword V
1 range 1
2 Normative references 1
3 Terms and Definitions 2
4 Quasi-peak measurement receiver, frequency range 9kHz~1000MHz 4
4.1 Overview 4
4.2 Input impedance 5
4.3 Sine wave voltage accuracy 5
4.4 impulse response 5
4.4.1 Amplitude relationship (absolute calibration) 5
4.4.2 Variation with repetition frequency (relative calibration) 5
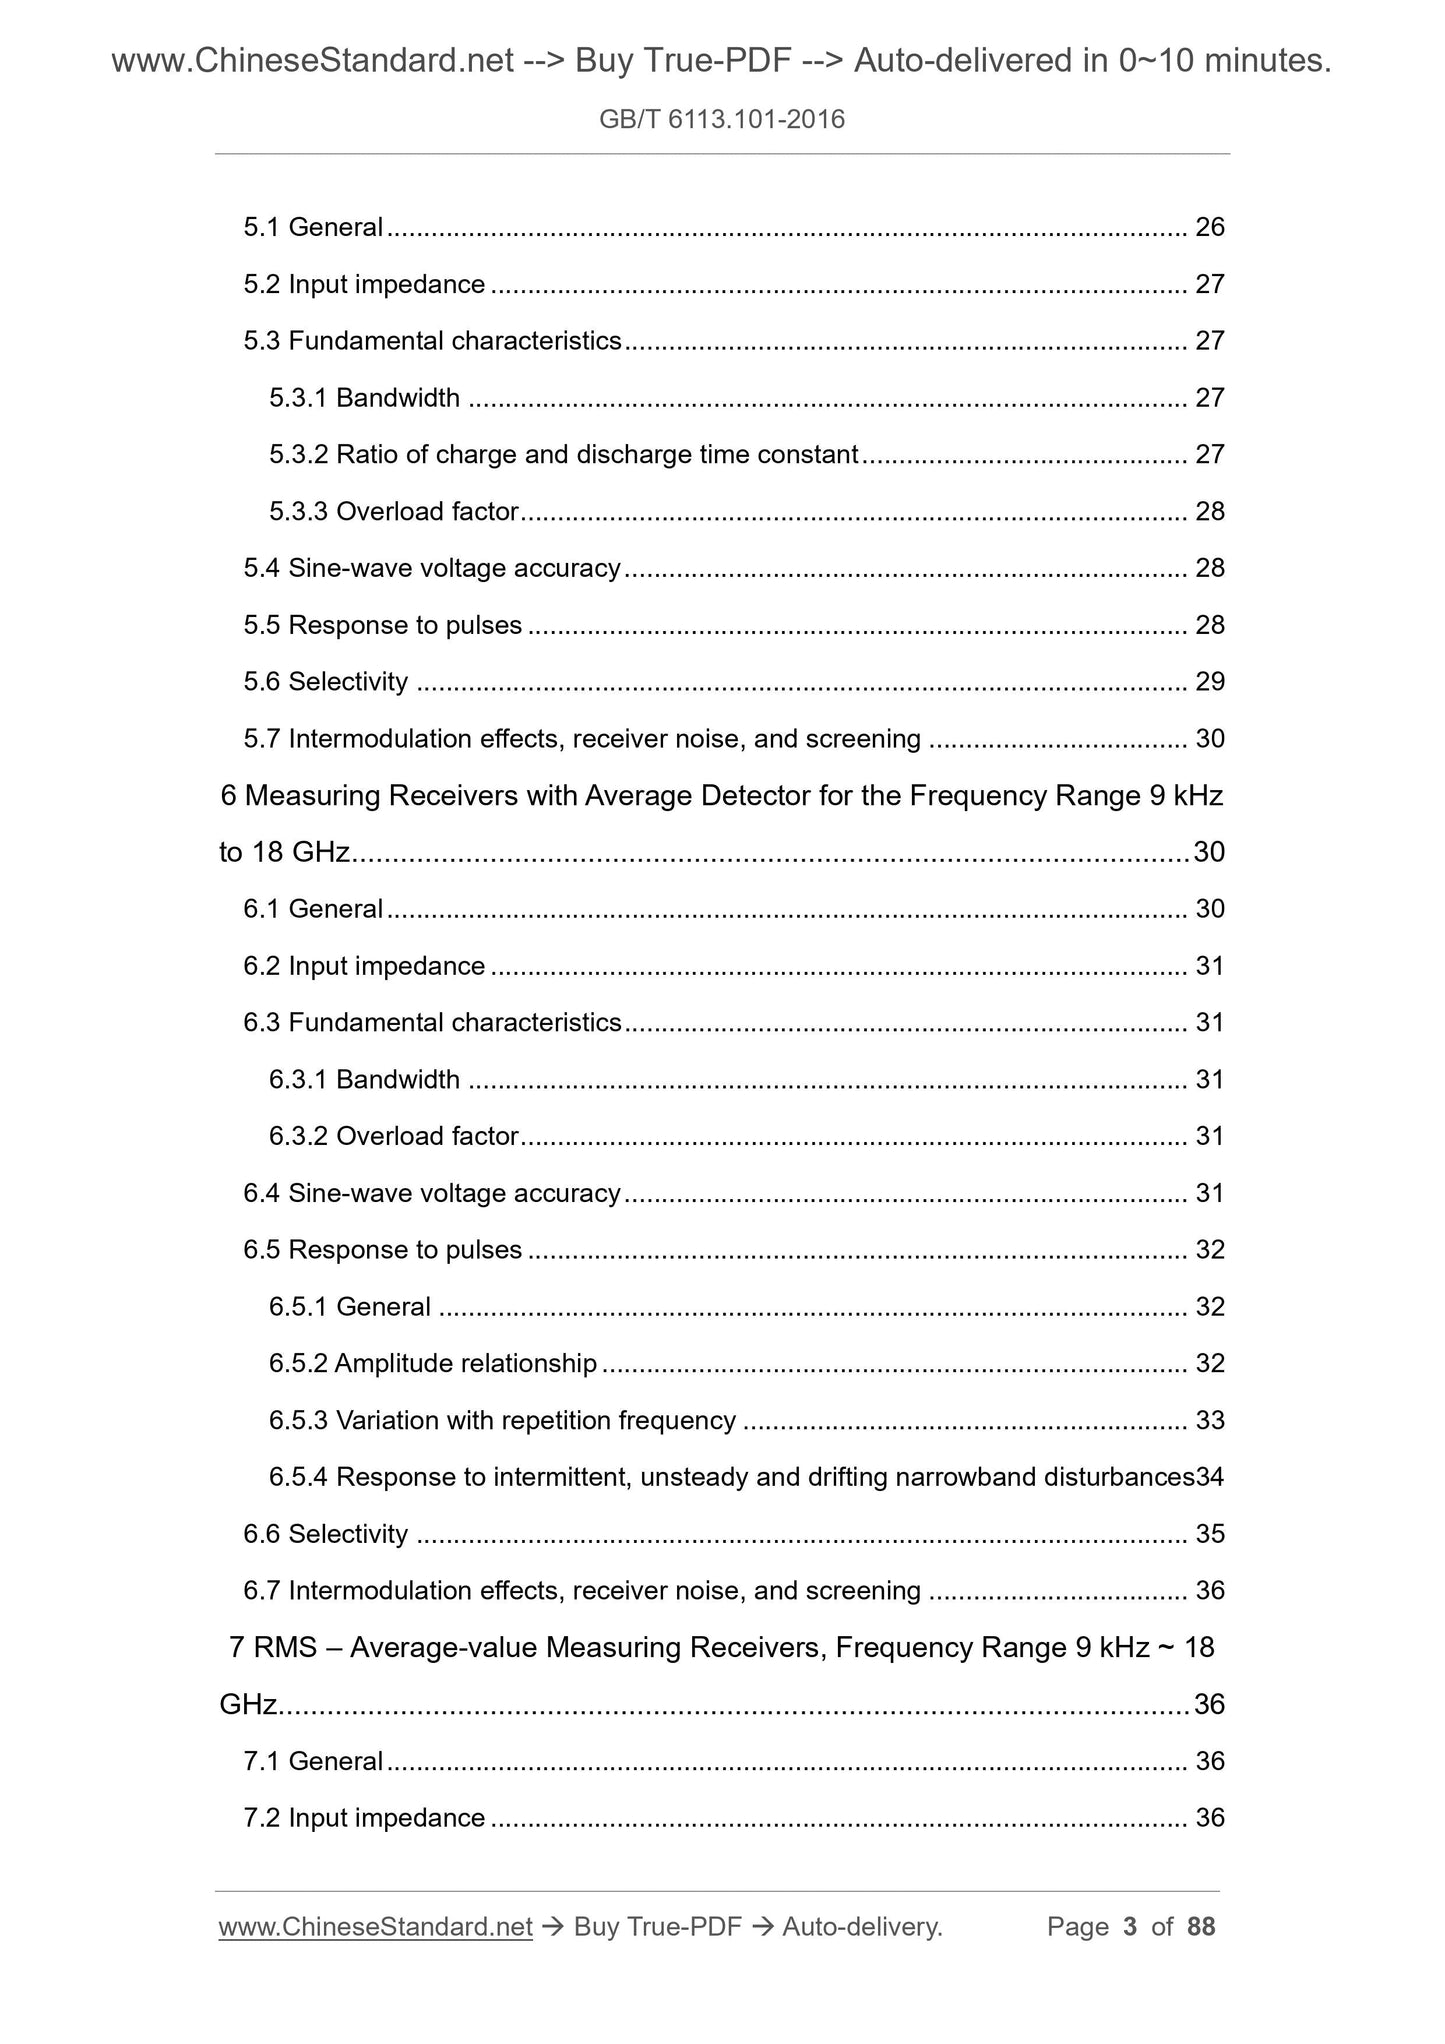
4.5 Option 8
4.5.1 Total selectivity (passband) 8
4.5.2 IF rejection ratio 9
4.5.3 Image frequency rejection ratio 9
4.5.4 Other spurious responses 9
4.6 Limitations of intermodulation effects 11
4.7 Limitation of measurement of noise inside the receiver and the spurious signal inside the machine 12
4.7.1 Random noise 12
4.7.2 Continuous wave 12
4.8 Shielding effectiveness 12
4.8.1 Overview 12
4.8.2 Limitation of measurement receiver RF emissions 13
4.9 Equipment connected to the Intermittent Disturbance Analyzer 13
5 Peak measurement receiver, frequency range 9kHz~18GHz 13
5.1 Overview 13
5.2 Input impedance 13
5.3 Basic Features 14
5.3.1 Bandwidth 14
5.3.2 Charge-discharge time constant ratio 14
5.3.3 Overload factor 14
5.4 Sinusoidal Voltage Accuracy 14
5.5 impulse response 14
5.6 Option 15
5.7 Intermodulation effects, receiver noise and shielding 16
6 Average measurement receiver, frequency range 9kHz~18GHz 16
6.1 Overview 16
6.2 Input impedance 16
6.3 Basic Features 17
6.3.1 Bandwidth 17
6.3.2 Overload factor 17
6.4 Sine Wave Voltage Accuracy 17
6.5 impulse response 17
6.5.1 Overview 17
6.5.2 Amplitude relationship 17
6.5.3 Variations with repetition frequency 18
6.5.4 Response to intermittent, unstable and drifting narrowband disturbances 19
6.6 Selectivity 20
6.7 Intermodulation effects, measurement of receiver noise and shielding 21
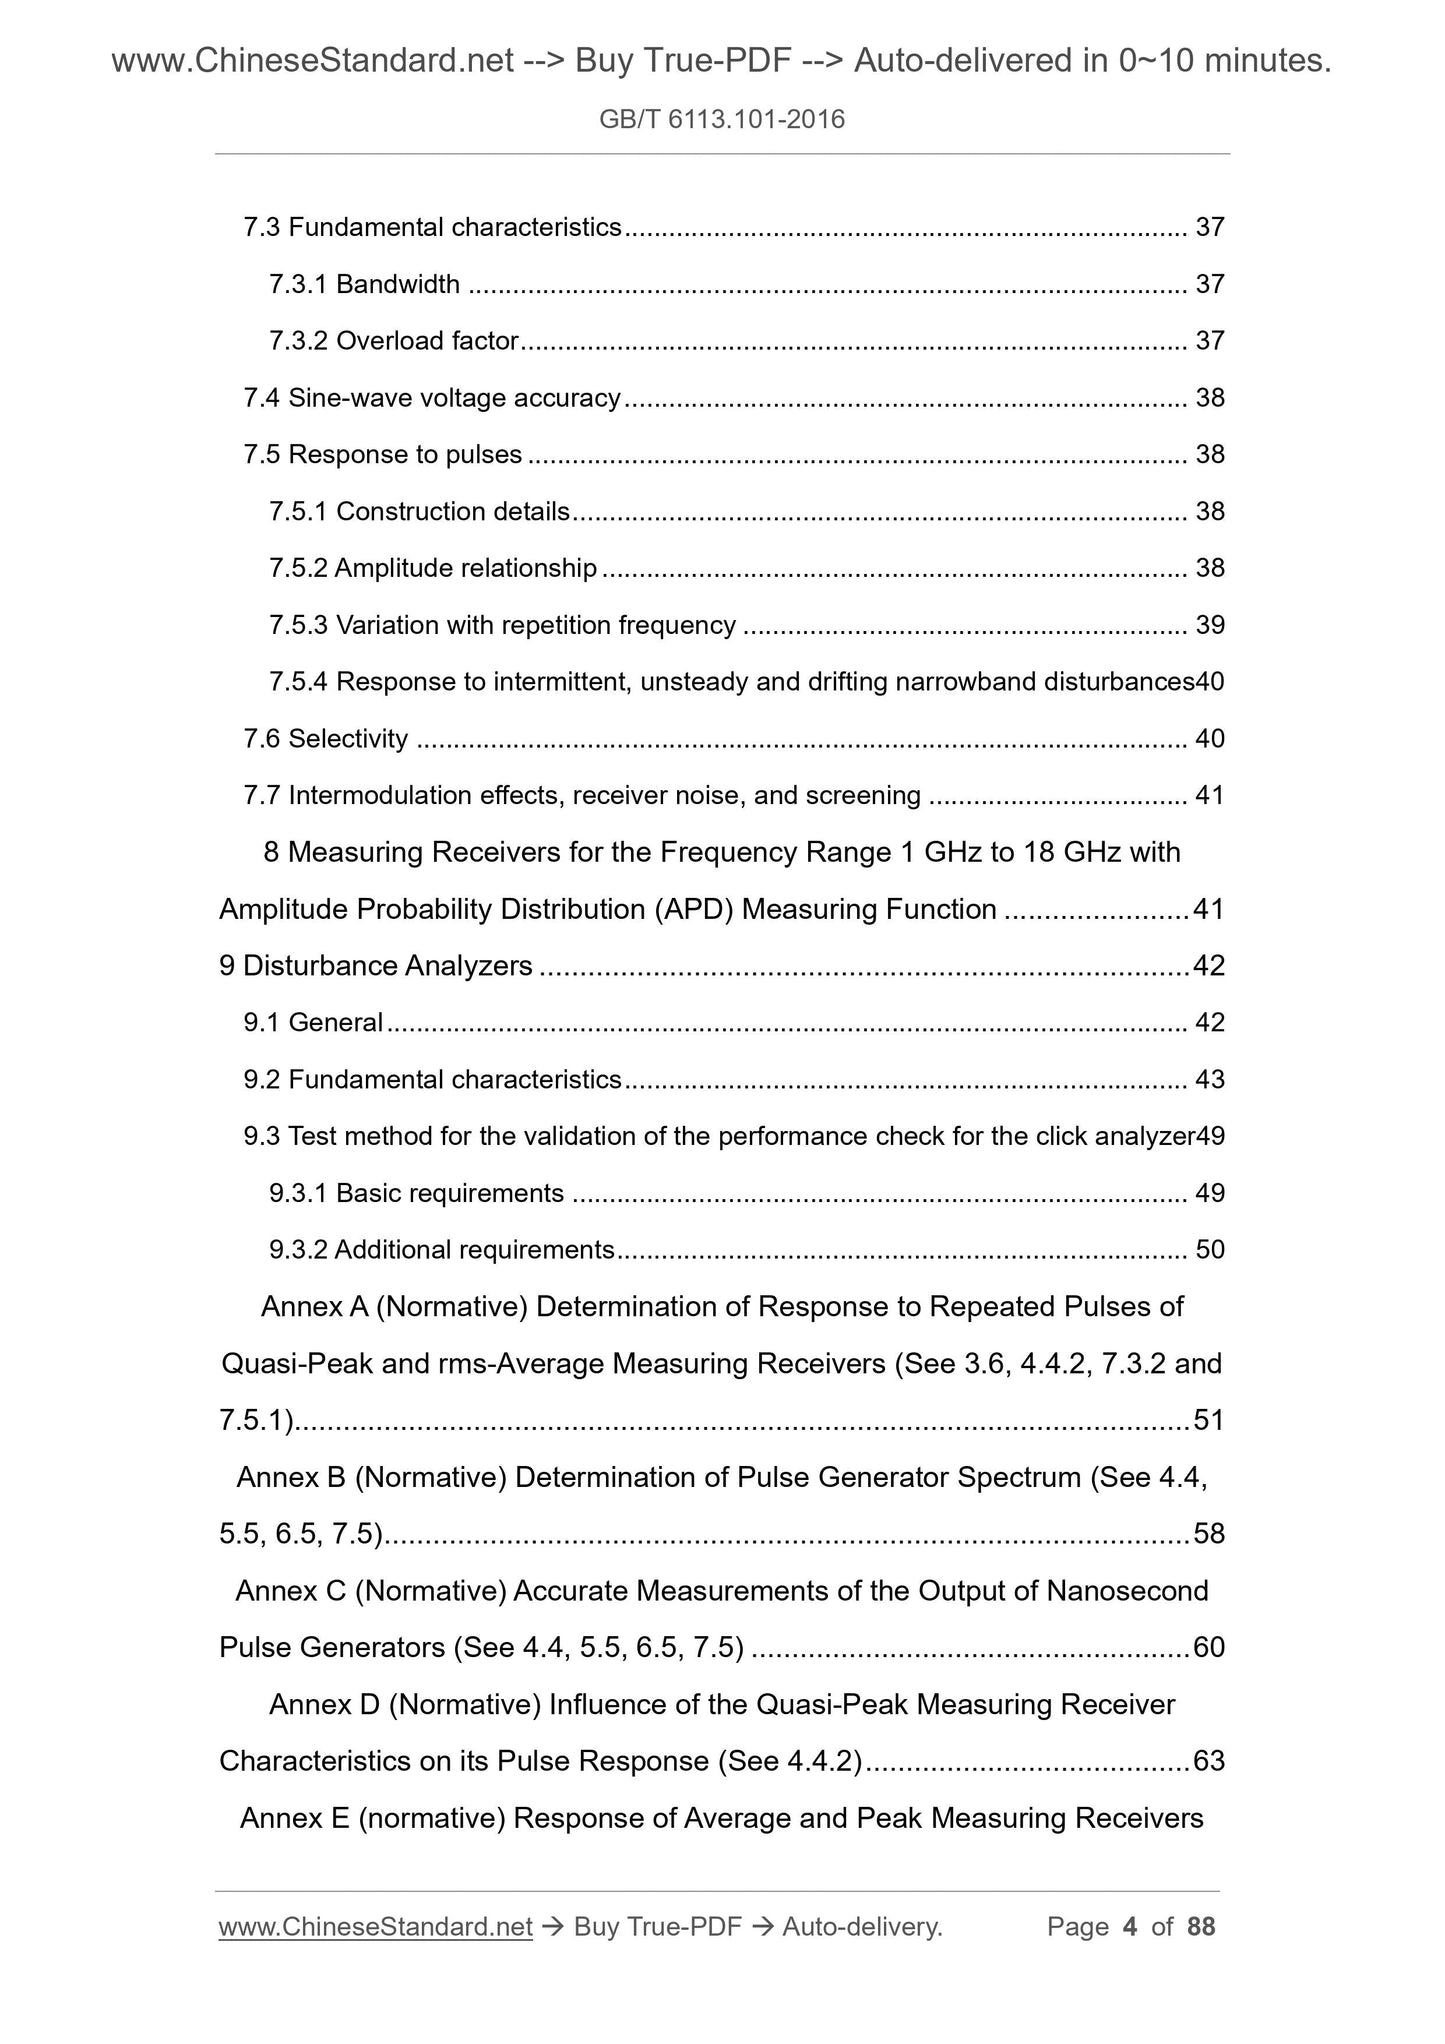
7 rms value---mean measurement receiver, frequency range 9kHz~18GHz 21
7.1 Overview 21
7.2 Input impedance 21
7.3 Basic characteristics 21
7.3.1 Bandwidth 21
7.3.2 Overload factor 22
7.4 Sine Wave Voltage Accuracy 22
7.5 impulse response 22
7.5.1 Detailed construction of the detector 22
7.5.2 Amplitude relationship 22
7.5.3 Changes with repetition frequency 23
7.5.4 Response to intermittent, unstable and drifting narrowband disturbances 23
7.6 Selectivity 24
7.7 Intermodulation effects, receiver noise and shielding 24
8 amplitude probability distribution measurement receiver, frequency range 1GHz~18GHz 24
9 Harassment Analyzer 25
9.1 Overview 25
9.2 Basic Features 25
9.3 Checking method for performance of click sound analyzer 31
9.3.1 Basic requirements 31
9.3.2 Additional requirements 32
Appendix A (Normative) Quasi-peak measurement receiver and rms value---mean measurement receiver for repeated impulse response
Confirm 33
Appendix B (Normative) Determination of the spectrum of the pulse generator 37
Appendix C (Normative) Accurate Measurement of Nanosecond Pulse Generator Output 39
Appendix D (Normative) Impact of quasi-peak measurement receiver characteristics on impulse response 41
Appendix E (Normative) Mean measurement receiver and peak measurement receiver response 42
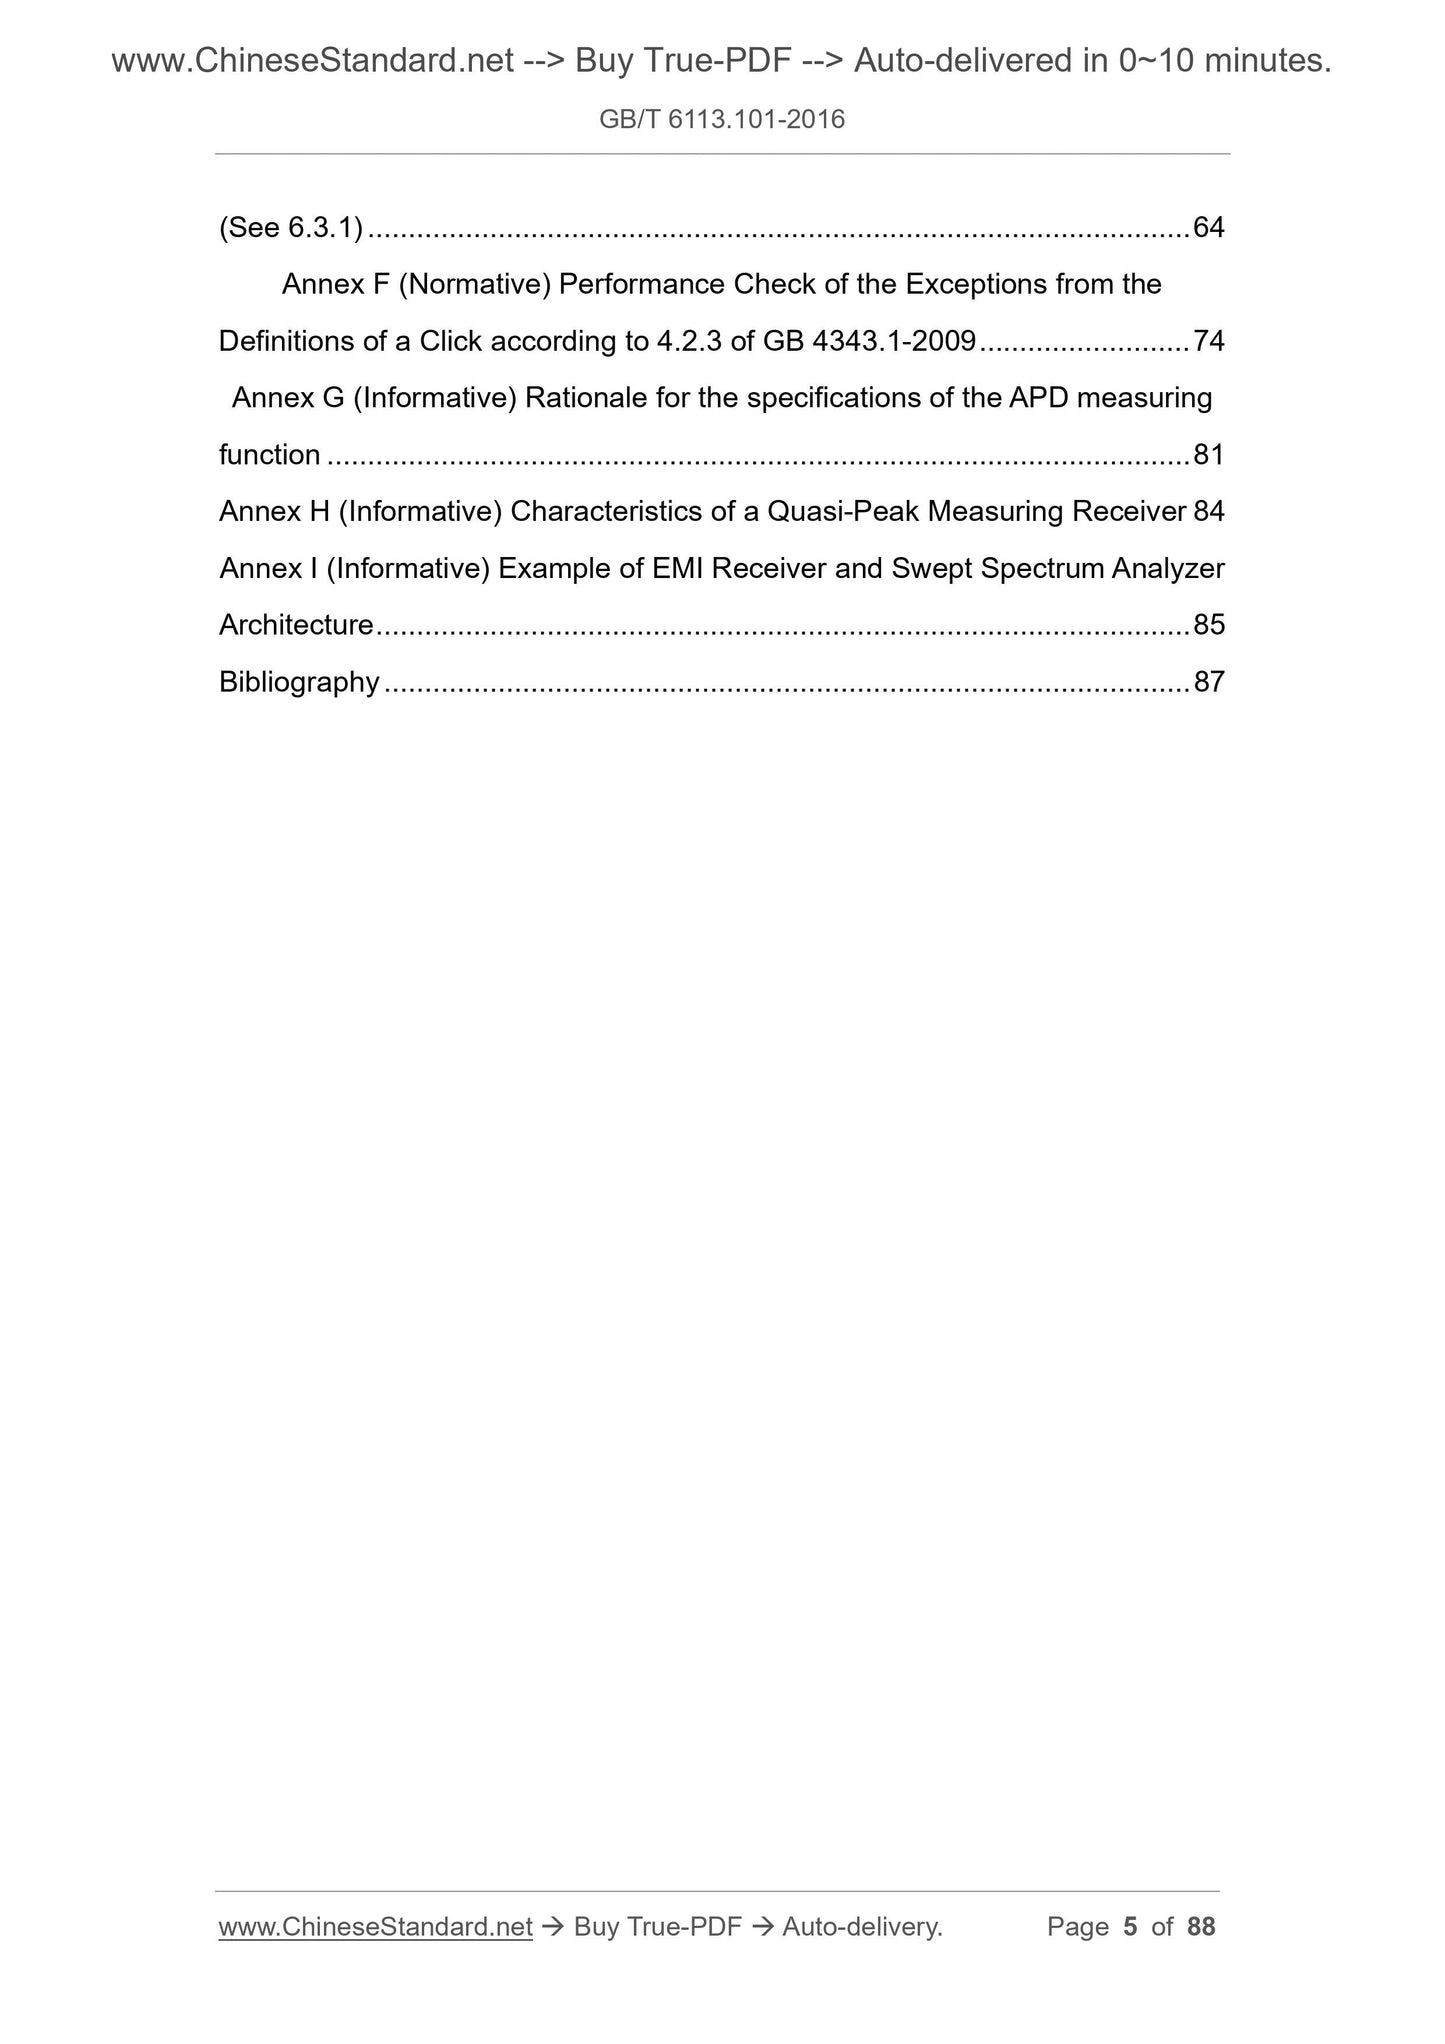
Appendix F (Normative Appendix) is different from the performance check of the click sound defined in 4.2.3 of GB 4343.1-2009.
Appendix G (informative) The basic principles of the APD measurement equipment specification 56
Appendix H (informative) Characteristics of quasi-peak measurement receivers 59
Appendix I (informative) Structure example of EMI receiver and swept spectrum analyzer 60
Reference 62
Figure 1 impulse response curve 6
Figure 2 Total selectivity limit 10
Figure 3 Test layout of the intermodulation effect Figure 11
Figure 4 Limits of total selectivity (passband) (E-band) 16
Figure 5 Average detector block diagram 19
Figure 6 Analog network instrument response to narrowband intermittent signals 20
Figure 7 Example of Harassment Analyzer 26
Figure 8 corresponds to the graph of the test signal used to confirm the performance of the clicker analyzer in Table 17.
Figure E.1 Correction factor for other tuned circuits when estimating the ratio of Bimp/B6 43
Figure E.2 Pulse detection coefficient P 44
Figure E.3 Spectrum example of a pulse-modulated carrier signal with a pulse width of.200 ns 46
Figure E.4 Pulse-modulated RF signal applied to the measurement receiver 47
Figure E.5 Filtering characteristics when Bimp is much smaller than the prf case 47
Figure E.6 Filtering characteristics when Bimp is much larger than the prf case 47
Figure E.7 Calculation of pulse width 48
Figure E.8 Normalized linear selection function legend 49
Figure F.1 Illustration of the test signal used to perform a performance check on the analyzer in accordance with the additional requirements of Table F.1 55
Figure G.1 Block diagram of the APD measurement circuit without A/D converter 57
Figure G.2 APD measurement circuit block diagram with A/D converter 57
Figure G.3 Example of APD measurement results 58
Figure I.1 EMI receiver frame with preselector, preamplifier and quasi-peak/average detector based on the swept spectrum analyzer
Figure example 60
Table 1 Characteristics of test pulses for quasi-peak measurement receivers (see 4.4.1) 5
Table 2 Impulse response of the quasi-peak measurement receiver 8
Table 3 Synthesis selectivity of CISPR measurement receiver and high-pass filter 9
Table 4 Bandwidth characteristics of the intermodulation test receiver intermodulation test (see 4.6) 12
Table 5 Standing wave ratio requirements for the input port of the peak measurement receiver 13
Table 6 Bandwidth Measurement Receiver Bandwidth Requirements 14
Table 7 Peak and quasi-peak measurement of the same bandwidth. Relative value of receiver impulse response (9 kHz to 1 GHz) 15
Table 8 Bandwidth Requirements 17
Table 9 Average value of the same bandwidth and the relative value of the quasi-peak measurement receiver impulse response (9 kHz to 1 GHz) 18
Table 10 Mean measurement receiver maximum reading of the response of a pulse-modulated sine wave input with the same amplitude to a continuous sine wave
Number ratio 19
Table 11 Standing wave ratio requirements for input impedance 21
Table 12 Root Mean Square Value---Average Measurement Receiver Bandwidth Requirements 21
Table 13 The lowest pulse repetition rate when loading 22
Table 14 Root Mean Square Value---Average and Quasi-Peak Measurement Receiver Relative Value of Impulse Response 23
Table 15 RMS value---mean measurement receiver impulse response 23
Table 16 RMS value---mean measurement receiver for pulse-modulated sine wave input and continuous sine wave with the same amplitude
The maximum reading of the response is 24
Table 17 Harassment Analyzer Performance Verific...
View full details