Skip to product information
1 of 6

PayPal, credit cards. Download editable-PDF and invoice in 1 second!

GB/T 40299-2021 English PDF (GBT40299-2021)

GB/T 40299-2021 English PDF (GBT40299-2021)

Regular price $230.00 USD
Regular price Sale price $230.00 USD
Sale Sold out
Shipping calculated at checkout.
Quotation: In 1-minute, 24-hr self-service. Click here GB/T 40299-2021 to get it for Purchase Approval, Bank TT...

GB/T 40299-2021: Corrosion of metals and alloys -- Conventions applicable to electrochemical measurements in corrosion testing

This Document specifies a common way to report and display electrochemical corrosion data, including potential, current density, electrochemical impedance, as well as the graphical representation of the above data.
GB/T 40299-2021
NATIONAL STANDARD OF THE
PEOPLE’S REPUBLIC OF CHINA
ICS 77.060
CCS H 25
GB/T 40299-2021 / ISO 17474:2012
Corrosion of Metals and Alloys – Conventions Applicable to
Electrochemical Measurements in Corrosion Testing
(ISO 17474:2012, IDT)
ISSUED ON: AUGUST 20, 2021
IMPLEMENTED ON: MARCH 01, 2022
Issued by: State Administration for Market Regulation;
Standardization Administration of the People’s Republic of China.
Table of Contents
Foreword ... 3
1 Scope ... 4
2 Normative References ... 4
3 Terms and Definitions ... 4
4 Meaning and Use ... 4
5 Electrode Potential Symbol ... 5
6 Current and Current Density Symbols ... 6
7 Representation of Polarization Data ... 6
8 Representation of Electrochemical Impedance Data ... 11
Appendix A (Informative) Reference Electrode and its Temperature Dependance ... 15 Bibliography ... 17
Corrosion of Metals and Alloys – Conventions Applicable to
Electrochemical Measurements in Corrosion Testing
WARNING: This Document is not intended to resolve all security issues related to it (if any). The user of this Document has a responsibility to determine appropriate safety and health practices and determine the applicability of regulatory restrictions before use. 1 Scope
This Document specifies a common way to report and display electrochemical corrosion data, including potential, current density, electrochemical impedance, as well as the graphical representation of the above data.
2 Normative References
The provisions in following documents become the provisions of this Document through normative reference in this Document. For the dated documents, only the versions with the dates indicated are applicable to this Document; for the undated documents, only the latest version (including all the amendments) is applicable to this Document.
ISO 8044 Corrosion of Metals and Alloys – Basic Terms and Definitions
3 Terms and Definitions
For the purposes of this Documents, the terms and definitions given in ISO 8044 apply. 4 Meaning and Use
This document provides guidance on methods for reporting, displaying, and plotting electrochemical corrosion data; and proposes recommends on symbols and conventions. Using the methods specified in this Document allows corrosion electrochemical data to be reported in a standard format that facilitates comparison of data obtained in different laboratories or at different time points. Corrosion data that are obtained from electrochemical tests, including potentiostatic and potentiodynamic polarization, polarization resistance, electrochemical impedance, galvanic corrosion and open circuit potential measurements, may be recorded and reported using the recommendations given in this Document.
1 – potentiometer;
2 – reference electrode;
3 – electrolyte;
4 – salt bridge;
5 – electrolytic cell;
6 - working electrode.
Figure 1 -- Schematic Diagram of the Experimental Setup for Measuring the Working Electrode Potential
6 Current and Current Density Symbols
In the current and current density symbols recommended in this Document, anodic and cathodic values are designated as positive and negative, respectively. When plotting the logarithmic relationship diagram between potential and current density, only the absolute value of the cathode current density can be plotted. In the logarithmic plot, if the cathodic and anodic values exist at the same time, the cathodic and anodic values shall be clearly distinguished. 7 Representation of Polarization Data
7.1 Symbols
This document recommends the use of standard mathematical plots to represent corrosion electrochemical data. In this plotting method, positive values shall be plotted in the area formed above the origin of the ordinate (y-axis) and in the area formed on the right of the origin of the abscissa (x-axis). In a logarithmic plot, the abscissa value increases from left to right, and the ordinate value increases from bottom to top.
7.2 Current density-potential diagram
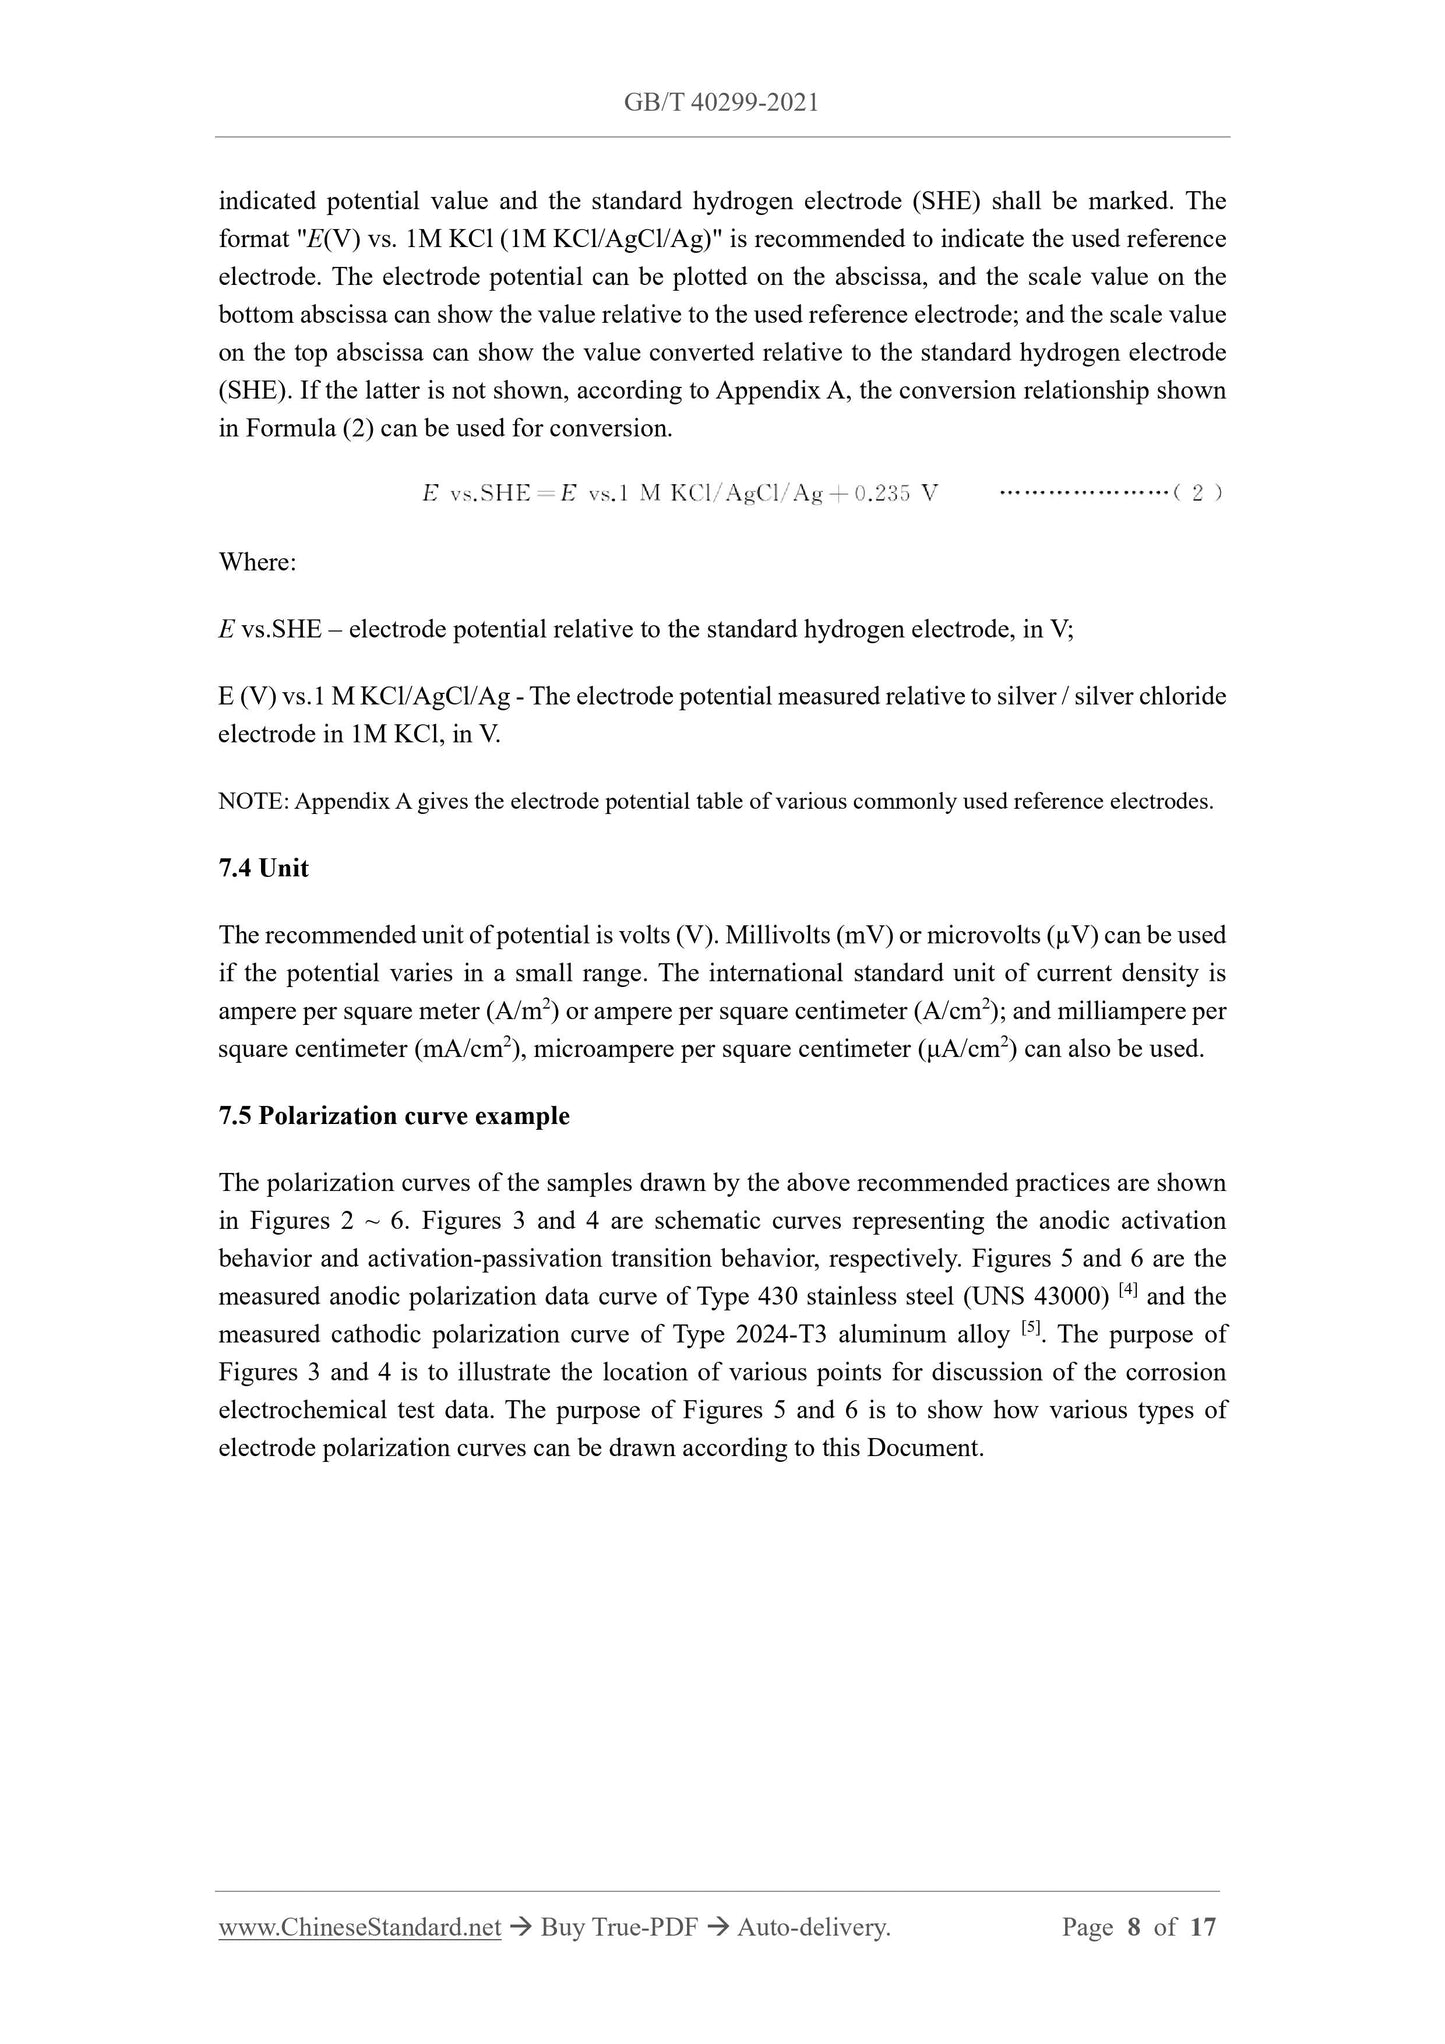
This Document recommends that when plotting current density and potential data diagram, the ordinate represents the current density and the abscissa represents the potential. In a current density-potential diagram, the current density can be plotted on a linear or logarithmic axis. Typically, logarithmic plots are used to display a wide range of current density data and to represent the Tafel relationship. Linear plots are used to study situations where the current density or potential range is very small, or to evaluate localized regions where the current density changes from anode to cathode. The linear graph is also used to determine the polarization resistance Rp. The polarization resistance Rp is defined as the inverse of the slope of the current density-potential curve at the corrosion potential Ecor. The relationship between indicated potential value and the standard hydrogen electrode (SHE) shall be marked. The format "E(V) vs. 1M KCl (1M KCl/AgCl/Ag)" is recommended to indicate the used reference electrode. The electrode potential can be plotted on the abscissa, and the scale value on the bottom abscissa can show the value relative to the used reference electrode; and the scale value on the top abscissa can show the value converted relative to the standard hydrogen electrode (SHE). If the latter is not shown, according to Appendix A, the conversion relationship shown in Formula (2) can be used for conversion.
Where:
E vs.SHE – electrode potential relative to the standard hydrogen electrode, in V; E (V) vs.1 M KCl/AgCl/Ag - The electrode potential measured relative to silver / silver chloride electrode in 1M KCl, in V.
NOTE: Appendix A gives the electrode potential table of various commonly used reference electrodes. 7.4 Unit
The recommended unit of potential is volts (V). Millivolts (mV) or microvolts (µV) can be used if the potential varies in a small range. The international standard unit of current density is ampere per square meter (A/m2) or ampere per square centimeter (A/cm2); and milliampere per square centimeter (mA/cm2), microampere per square centimeter (μA/cm2) can also be used. 7.5 Polarization curve example
The polarization curves of the samples drawn by the above recommended practices are shown in Figures 2 ~ 6. Figures 3 and 4 are schematic curves representing the anodic activation behavior and activation-passivation transition behavior, respectively. Figures 5 and 6 are the measured anodic polarization data curve of Type 430 stainless steel (UNS 43000) [4] and the measured cathodic polarization curve of Type 2024-T3 aluminum alloy [5]. The purpose of Figures 3 and 4 is to illustrate the location of various points for discussion of the corrosion electrochemical test data. The purpose of Figures 5 and 6 is to show how various types of electrode polarization curves can be drawn according to this Document.
distance between the data point and the origin. The higher frequency data points are usually located near the origin, while the lower frequency points are farther away from the origin. 8.2.3 The recommended units for the two coordinate axes are ohms square centimeters (Ω•cm2). The impedance value, in Ω•cm2, can be obtained by multiplying the measured impedance value by the exposed area of the sample. For equivalent circuits of resistors, capacitors or virtual components, an area of 1cm2 is assumed. Regarding the equivalent circuit of Figure 7, in the impedance data shown in Figure 8, the distance from the origin to the intersection between the data curve and the first (high frequency) point of the abscissa corresponds to Rs; the distance from the intersection between the data curve and the first (high frequency) point of the abscissa to the intersection between the data curve and the second (low frequency) corresponds to Rp. 8.3 Bode plot
8.3.1 The electrochemical impedance data can be represented by a Bode plot, which consists of a set of two types of curves, one of which is: the abscissa is the logarithm of the frequency to the base 10, and the ordinate is the logarithm of the impedance magnitude or modulus |Z| to the base 10. The right side of the origin is the frequency value; and the upper part of the origin is the impedance modulus value. The origin can be selected at an appropriate non-zero value of the impedance modulus and frequency.
8.3.2 Another type of curve mentioned in 8.3.1 is: the logarithm of the frequency to the base 10 is plotted on the abscissa, and the phase angle or phase shift is linearly plotted on the ordinate. The increase of negative value in the phase angle are plotted down the ordinate; and the capacitive phase angle is plotted at -90°.
8.3.3 Figures 9a) and 9b) show a typical set of plot formats for the equivalent circuit model shown in Figure 7. The frequency independent high-frequency impedance value corresponds to Rs. The frequency independent low-frequency impedance value corresponds to Rs+Rp. The

View full details