GB/T 38569-2020 English PDF (GBT38569-2020)
Regular price
$85.00 USD
Regular price
Sale price
$85.00 USD
Unit price
/
per
Delivery: 3 seconds. Download true-PDF + Invoice.
Get QUOTATION in 1-minute: Click GB/T 38569-2020
Historical versions: GB/T 38569-2020
Preview True-PDF (Reload/Scroll if blank)
GB/T 38569-2020: Performance evaluation of industrial microorganism strain -- Raman spectroscopy
GB/T 38569-2020
GB
NATIONAL STANDARD OF THE
PEOPLE’S REPUBLIC OF CHINA
ICS 07.080
A 21
Performance evaluation of industrial microorganism
strain - Raman spectroscopy
ISSUED ON: MARCH 31, 2020
IMPLEMENTED ON: MARCH 31, 2020
Issued by: State Administration for Market Regulation;
Standardization Administration of the People’s Republic of
China.
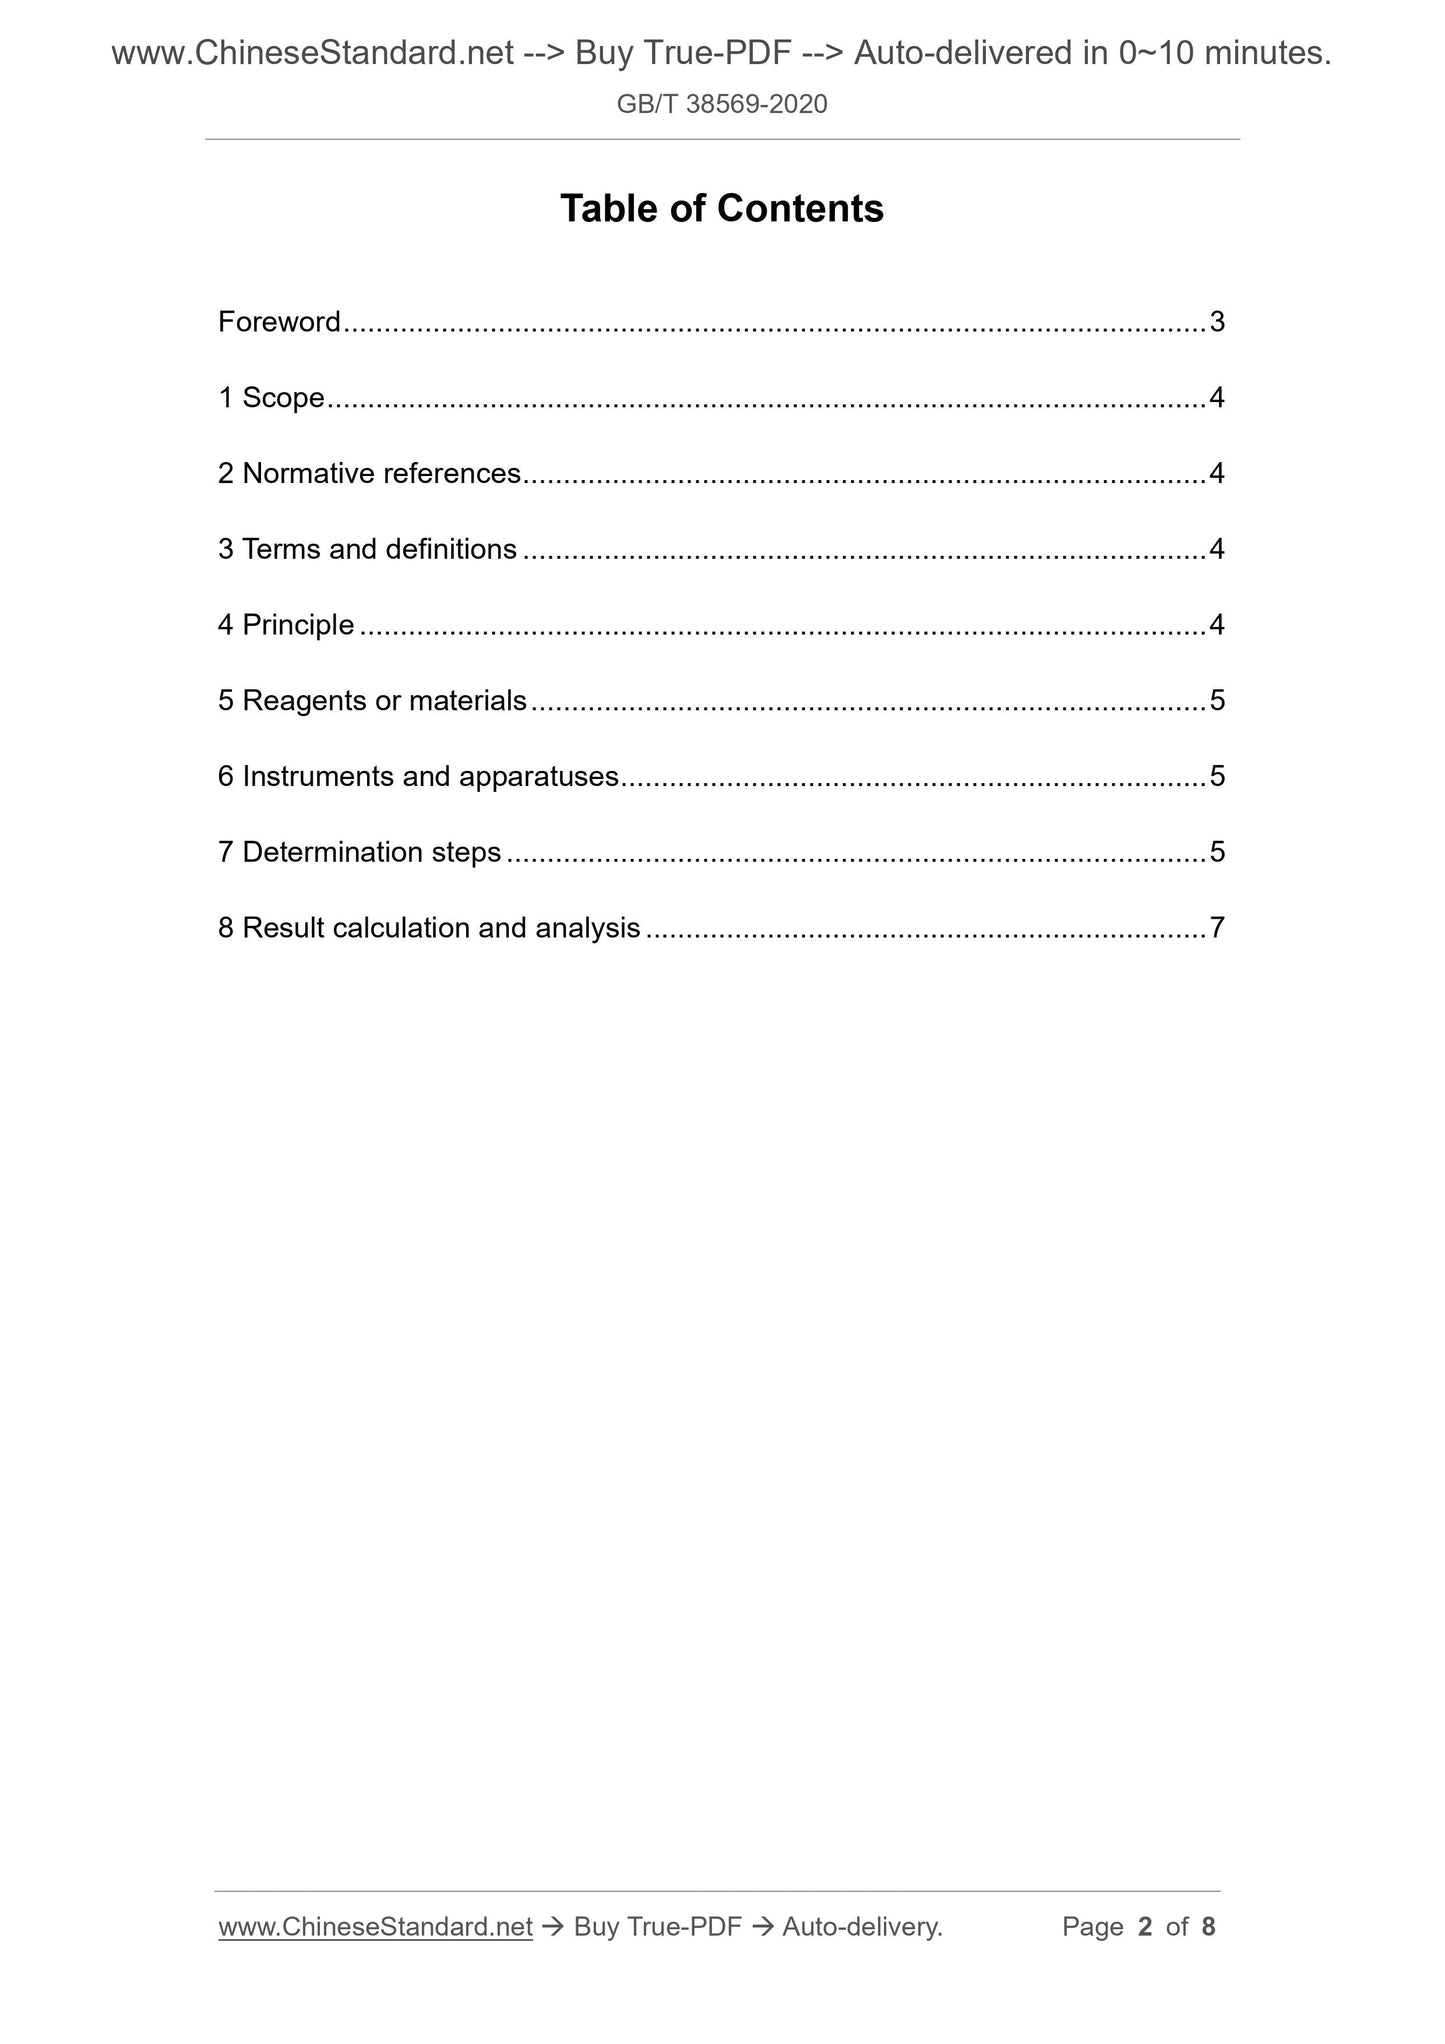
Table of Contents
Foreword ... 3
1 Scope ... 4
2 Normative references ... 4
3 Terms and definitions ... 4
4 Principle ... 4
5 Reagents or materials ... 5
6 Instruments and apparatuses ... 5
7 Determination steps ... 5
8 Result calculation and analysis ... 7
Performance evaluation of industrial microorganism
strain - Raman spectroscopy
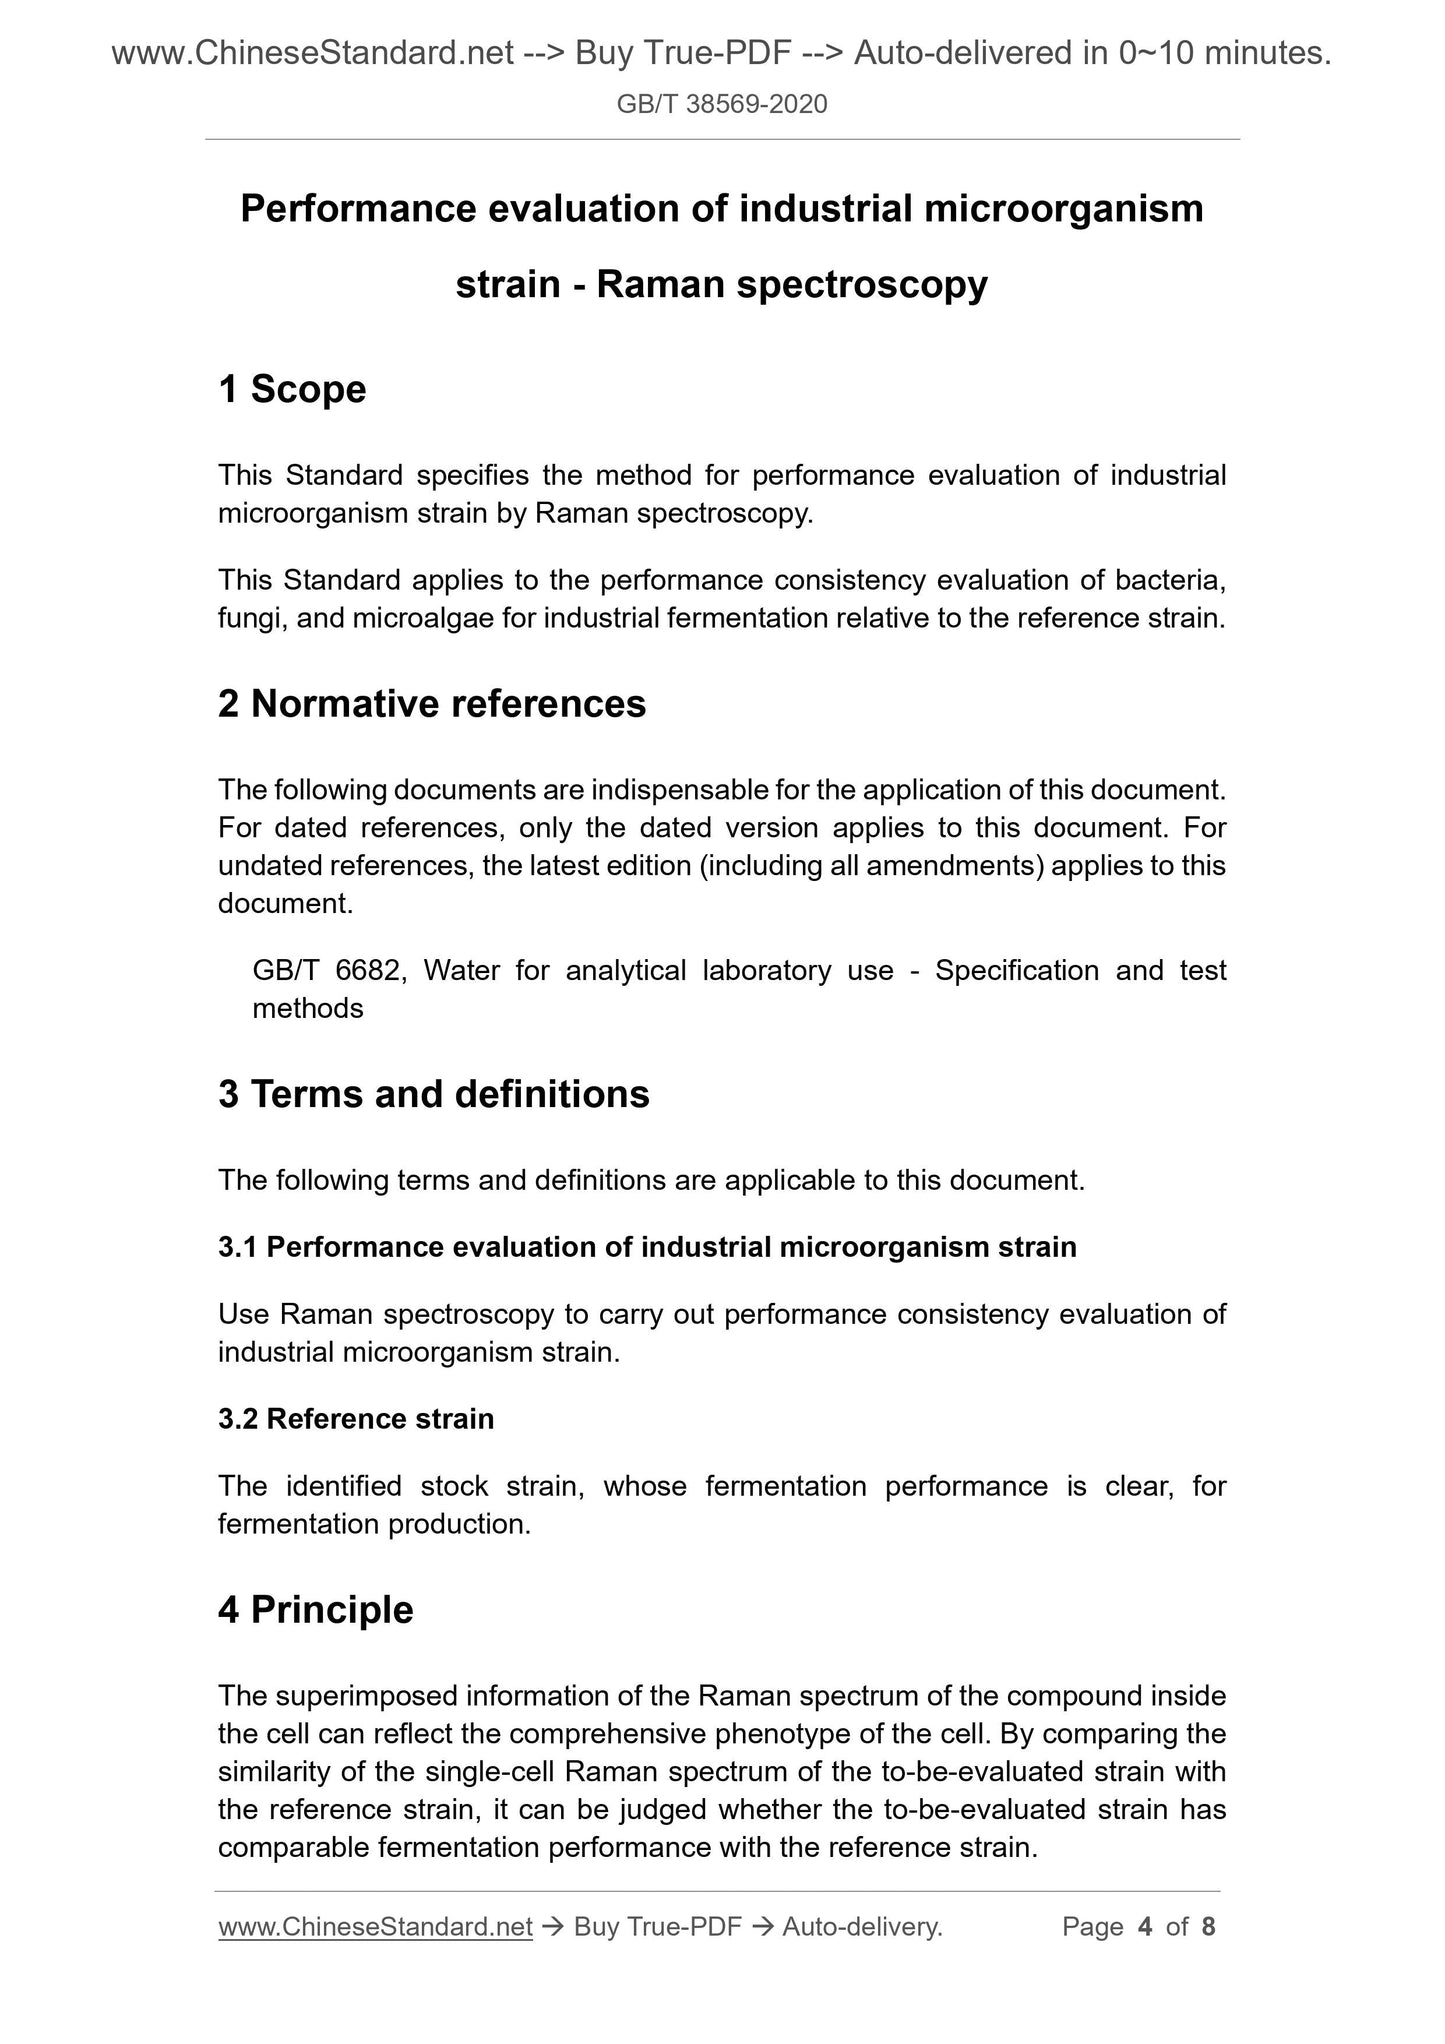
1 Scope
This Standard specifies the method for performance evaluation of industrial
microorganism strain by Raman spectroscopy.
This Standard applies to the performance consistency evaluation of bacteria,
fungi, and microalgae for industrial fermentation relative to the reference strain.
2 Normative references
The following documents are indispensable for the application of this document.
For dated references, only the dated version applies to this document. For
undated references, the latest edition (including all amendments) applies to this
document.
GB/T 6682, Water for analytical laboratory use - Specification and test
methods
3 Terms and definitions
The following terms and definitions are applicable to this document.
3.1 Performance evaluation of industrial microorganism strain
Use Raman spectroscopy to carry out performance consistency evaluation of
industrial microorganism strain.
3.2 Reference strain
The identified stock strain, whose fermentation performance is clear, for
fermentation production.
4 Principle
The superimposed information of the Raman spectrum of the compound inside
the cell can reflect the comprehensive phenotype of the cell. By comparing the
similarity of the single-cell Raman spectrum of the to-be-evaluated strain with
the reference strain, it can be judged whether the to-be-evaluated strain has
comparable fermentation performance with the reference strain.
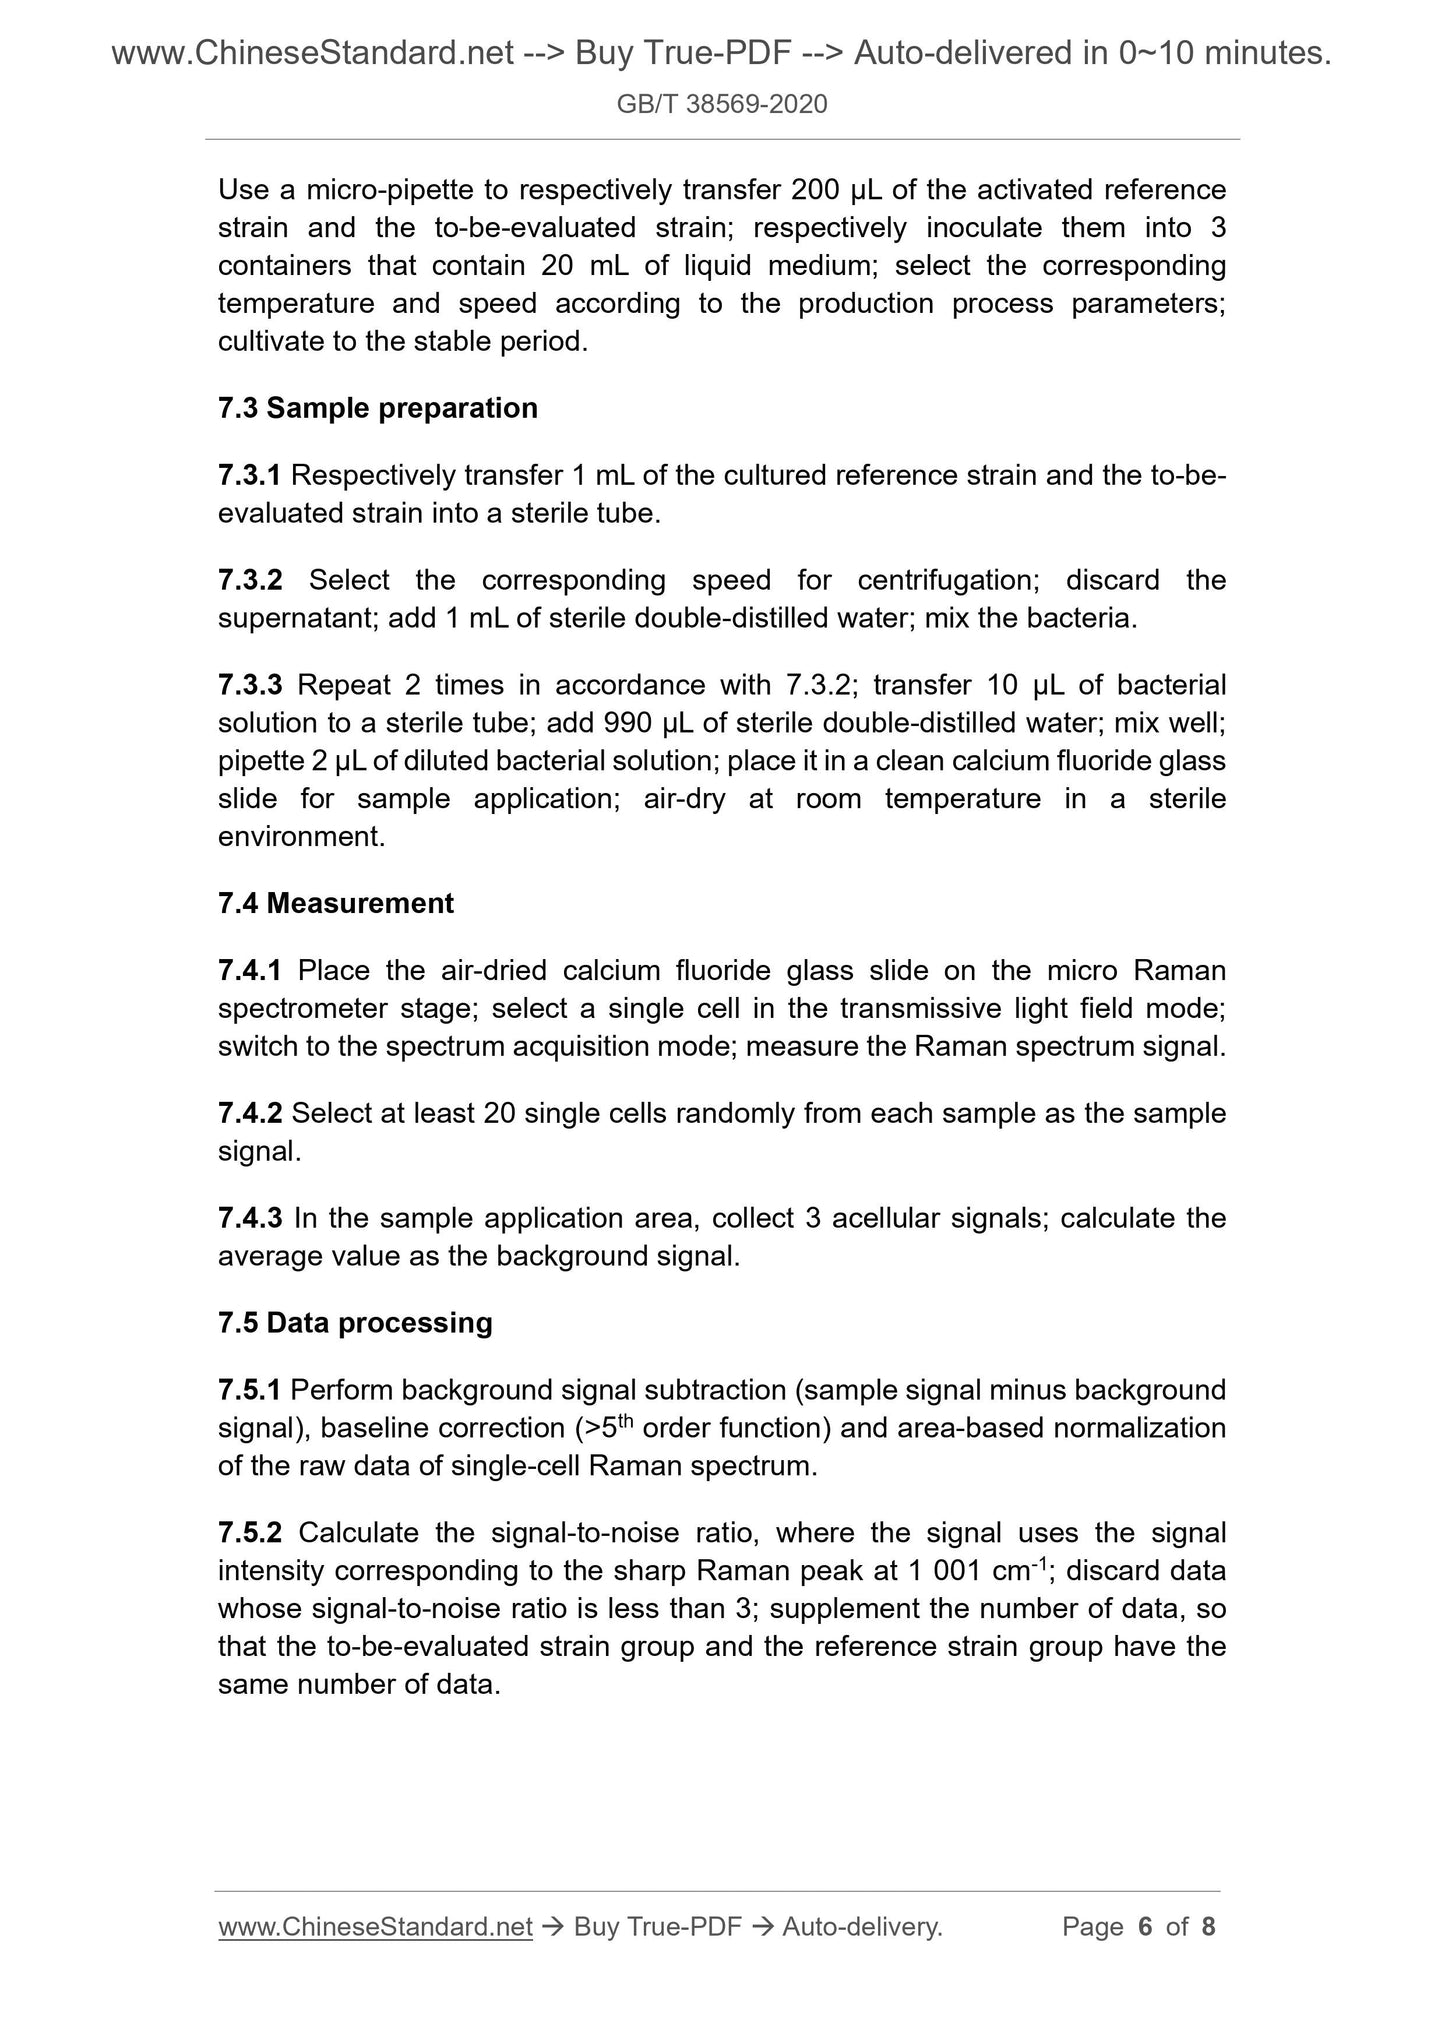
Use a micro-pipette to respectively transfer 200 μL of the activated reference
strain and the to-be-evaluated strain; respectively inoculate them into 3
containers that contain 20 mL of liquid medium; select the corresponding
temperature and speed according to the production process parameters;
cultivate to the stable period.
7.3 Sample preparation
7.3.1 Respectively transfer 1 mL of the cultured reference strain and the to-be-
evaluated strain into a sterile tube.
7.3.2 Select the corresponding speed for centrifugation; discard the
supernatant; add 1 mL of sterile double-distilled water; mix the bacteria.
7.3.3 Repeat 2 times in accordance with 7.3.2; transfer 10 μL of bacterial
solution to a sterile tube; add 990 μL of sterile double-distilled water; mix well;
pipette 2 μL of diluted bacterial solution; place it in a clean calcium fluoride glass
slide for sample application; air-dry at room temperature in a sterile
environment.
7.4 Measurement
7.4.1 Place the air-dried calcium fluoride glass slide on the micro Raman
spectrometer stage; select a single cell in the transmissive light field mode;
switch to the spectrum acquisition mode; measure the Raman spectrum signal.
7.4.2 Select at least 20 single cells randomly from each sample as the sample
signal.
7.4.3 In the sample application area, collect 3 acellular signals; calculate the
average value as the background signal.
7.5 Data processing
7.5.1 Perform background signal subtraction (sample signal minus background
signal), baseline correction (>5th order function) and area-based normalization
of the raw data of single-cell Raman spectrum.
7.5.2 Calculate the signal-to-noise ratio, where the signal uses the signal
intensity corresponding to the sharp Raman peak at 1 001 cm-1; discard data
whose signal-to-noise ratio is less than 3; supplement the number of data, so
that the to-be-evaluated strain group and the reference strain group have the
same number of data.