Skip to product information
1 of 10

PayPal, credit cards. Download editable-PDF and invoice in 1 second!

GB/T 24370-2009 English PDF (GB/T24370-2009)

GB/T 24370-2009 English PDF (GB/T24370-2009)

Regular price $540.00
Regular price Sale price $540.00
Sale Sold out
Shipping calculated at checkout.
GB/T 24370-2009: Characterization of CdSe quantum dot nanocrystals-UV-Vis absorption spectroscopy
Delivery: 9 seconds. Download (and Email) true-PDF + Invoice.
Newer version: (Replacing this standard) GB/T 24370-2021
Get Quotation: Click GB/T 24370-2009 (Self-service in 1-minute)
Historical versions (Master-website): GB/T 24370-2021
Preview True-PDF (Reload/Scroll-down if blank)


GB/T 24370-2009
GB
NATIONAL STANDARD OF THE
PEOPLE’S REPUBLIC OF CHINA
ICS 71.040.50
G 30
Characterization of CdSe Quantum Dot Nanocrystals - UV-
Vis Absorption Spectroscopy
REPLACED
ISSUED ON. SEPTEMBER 30, 2009
IMPLEMENTED ON. DECEMBER 1, 2009
Issued by. General Administration of Quality Supervision, Inspection and
Quarantine of the People’s Republic of China;
Standardization Administration of the People’s Republic of China.
Table of Contents
Foreword... 3
Introduction... 4
1 Scope... 5
2 Normative References... 5
3 Terms and Definitions... 5
4 Method Principles... 6
5 Instruments... 9
6 Preparation and Preservation of Test Samples... 10
7 Analysis Procedures... 10
8 Test Data Processing and Result Analysis... 11
9 Test Report... 12
Appendix A (informative) UV-Vis Absorption Spectral Line Analysis of Cadmium
Selenide Quantum Dot Nanocrystals... 13
Appendix B (informative) Synthesis of Cadmium Selenide Quantum Dot Nanocrystals
by High-temperature Oil Phase Pyrolysis Method... 17
Appendix C (informative) Test Report... 19
Bibliography... 20
Characterization of CdSe Quantum Dot Nanocrystals - UV-
Vis Absorption Spectroscopy
1 Scope
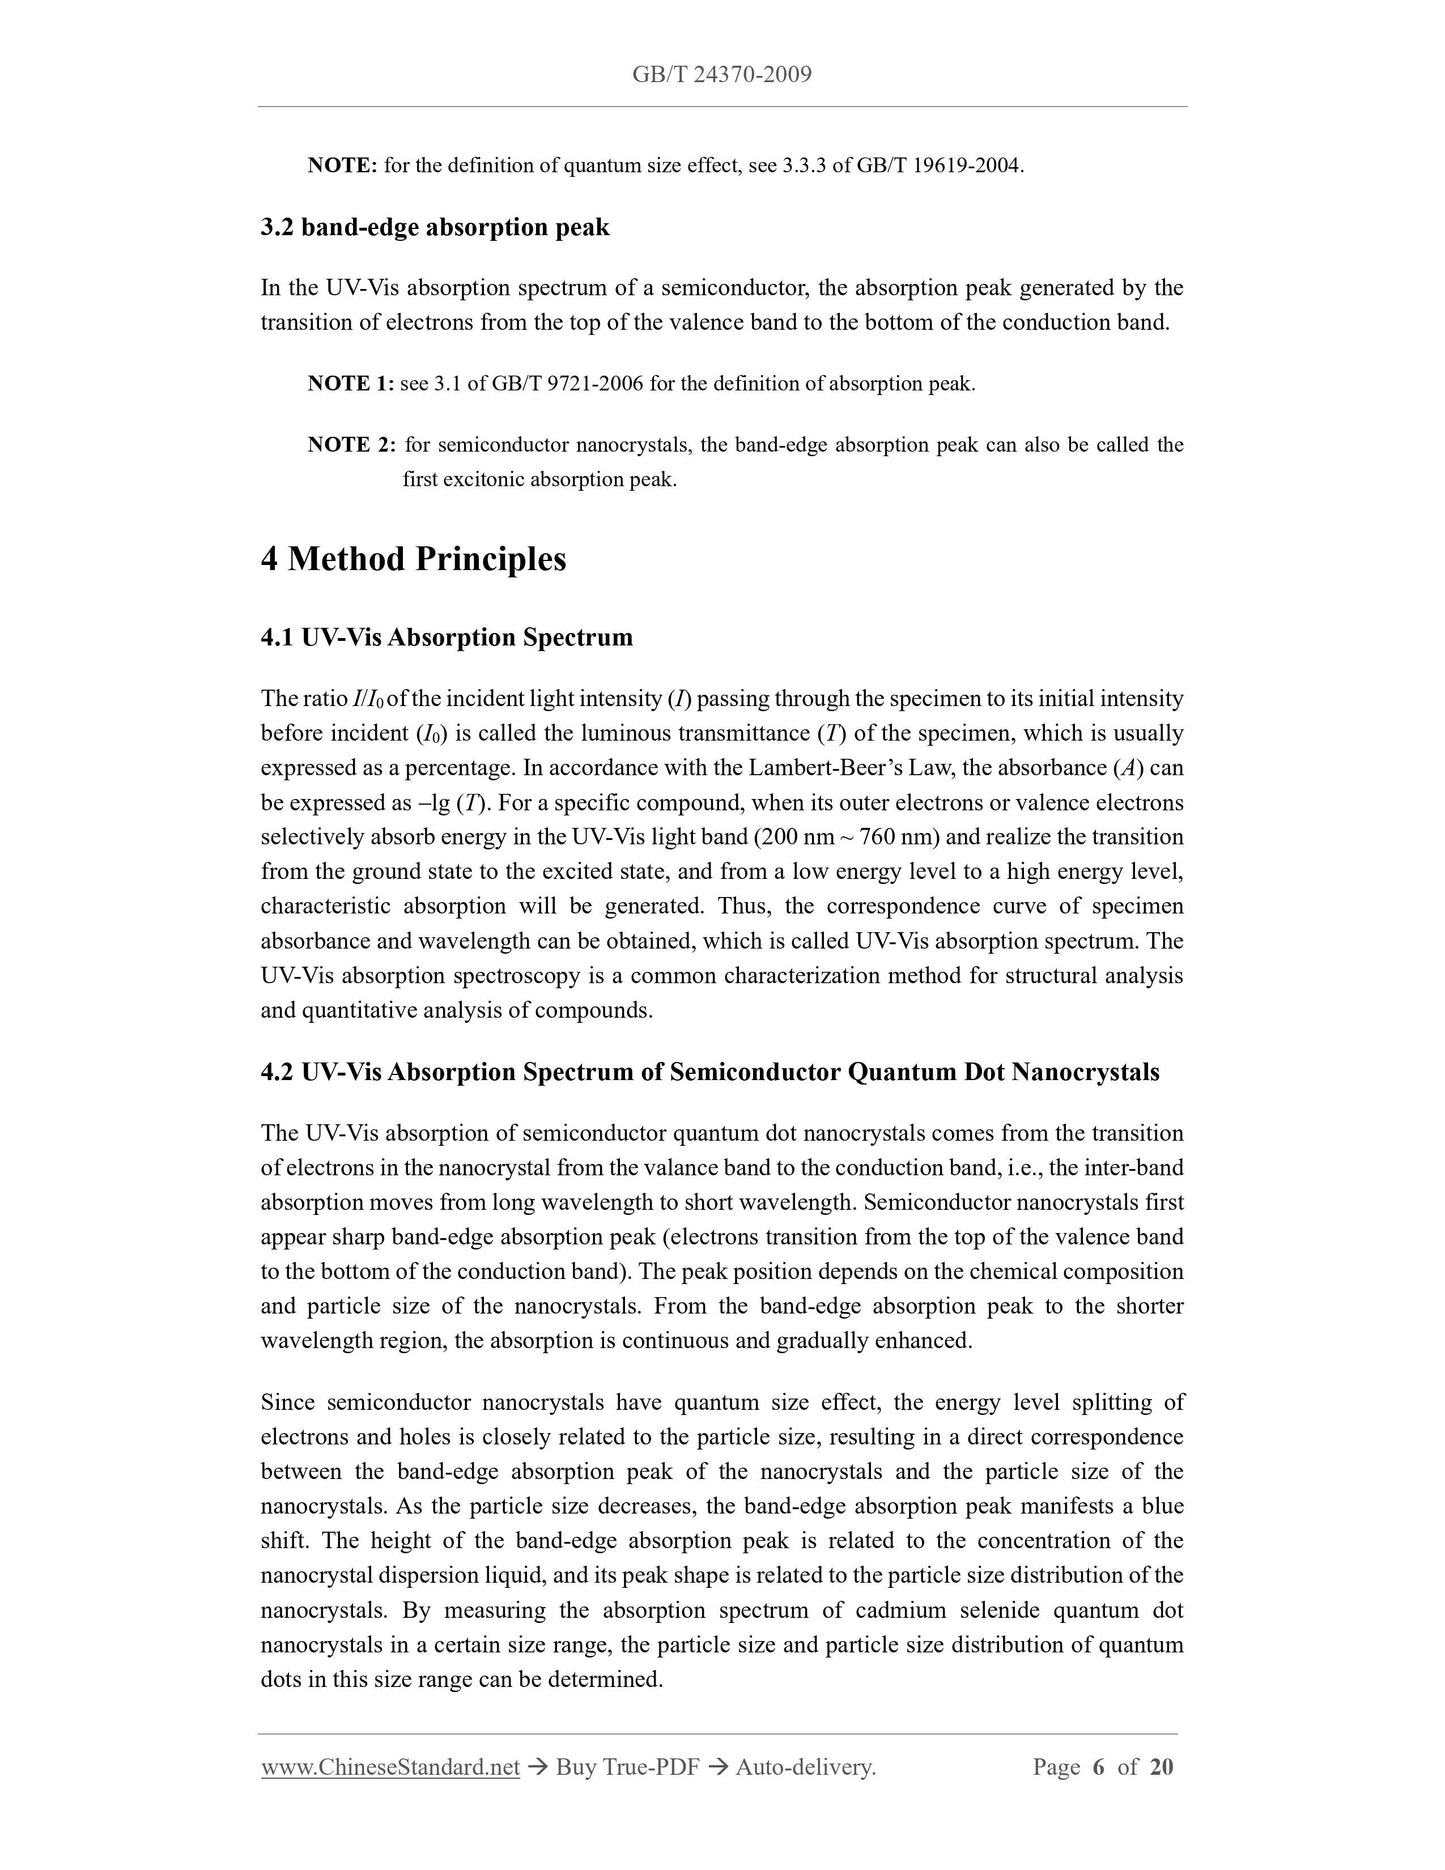
This Standard specifies the UV-Vis absorption spectroscopy for the characterization of
cadmium selenide (CdSe) quantum dot nanocrystals.
This Standard is applicable to the dispersion liquid of cadmium selenide quantum dot
nanocrystals coated with surfactant molecule---TOPO, Trioctylphosphine formed in n-hexane.
The UV-Vis absorption spectrum characterization of dispersion liquids of cadmium selenide
quantum dot nanocrystals coated with other surfactant molecules formed in various non-polar
reagents, cadmium selenide quantum dot nanocrystals synthesized in aqueous systems and
semiconductor quantum dot nanocrystals of other compositions may also take this Standard as
a reference.
2 Normative References
The clauses in the following documents become clauses of this Standard through reference in
this Standard. In terms of references with a specified date, all subsequent amendments
(excluding corrigenda) or revisions do not apply to this Standard. However, parties to an
agreement based on this Standard are encouraged to explore the possibility of adopting the latest
versions of these documents. In terms of references without a specified date, the latest version
applies to this Standard.
GB/T 9721-2006 Chemical Reagent - General Rules for the Molecular Absorption
Spectrophotometry (ultraviolet and visible)
GB/T 19267.2-2003 Physical and Chemical Examination of Trace Evidence in Forensic
Sciences - Part 2.Ultraviolet-visible Absorption Spectroscopy
GB/T 19619-2004 Terminology for Nanomaterials
JJG 178-2007 Ultraviolet, Visible, Near-infrared Spectrophotometers
3 Terms and Definitions
The terms and definitions defined in GB/T 19619-2004, and the following are applicable to this
Standard.
3.1 quantum dot nanocrystals
Nanocrystals with quantum size effect at room temperature.
NOTE. for the definition of quantum size effect, see 3.3.3 of GB/T 19619-2004.
3.2 band-edge absorption peak
In the UV-Vis absorption spectrum of a semiconductor, the absorption peak generated by the
transition of electrons from the top of the valence band to the bottom of the conduction band.
NOTE 1.see 3.1 of GB/T 9721-2006 for the definition of absorption peak.
NOTE 2.for semiconductor nanocrystals, the band-edge absorption peak can also be called the
first excitonic absorption peak.
4 Method Principles
4.1 UV-Vis Absorption Spectrum
The ratio I/I0 of the incident light intensity (I) passing through the specimen to its initial intensity
before incident (I0) is called the luminous transmittance (T) of the specimen, which is usually
expressed as a percentage. In accordance with the Lambert-Beer’s Law, the absorbance (A) can
be expressed as lg (T). For a specific compound, when its outer electrons or valence electrons
selectively absorb energy in the UV-Vis light band (200 nm ~ 760 nm) and realize the transition
from the ground state to the excited state, and from a low energy level to a high energy level,
characteristic absorption will be generated. Thus, the correspondence curve of specimen
absorbance and wavelength can be obtained, which is called UV-Vis absorption spectrum. The
UV-Vis absorption spectroscopy is a common characterization method for structural analysis
and quantitative analysis of compounds.
4.2 UV-Vis Absorption Spectrum of Semiconductor Quantum Dot Nanocrystals
The UV-Vis absorption of semiconductor quantum dot nanocrystals comes from the transition
of electrons in the nanocrystal from the valance band to the conduction band, i.e., the inter-band
absorption moves from long wavelength to short wavelength. Semiconductor nanocrystals first
appear sharp band-edge absorption peak (electrons transition from the top of the valence band
to the bottom of the conduction band). The peak position depends on the chemical composition
and particle size of the nanocrystals. From the band-edge absorption peak to the shorter
wavelength region, the absorption is continuous and gradually enhanced.
Since semiconductor nanocrystals have quantum size effect, the energy level splitting of
electrons and holes is closely related to the particle size, resulting in a direct correspondence
between the band-edge absorption peak of the nanocrystals and the particle size of the
nanocrystals. As the particle size decreases, the band-edge absorption peak manifests a blue
shift. The height of the band-edge absorption peak is related to the concentration of the
nanocrystal dispersion liquid, and its peak shape is related to the particle size distribution of the
nanocrystals. By measuring the absorption spectrum of cadmium selenide quantum dot
nanocrystals in a certain size range, the particle size and particle size distribution of quantum
dots in this size range can be determined.
6 Preparation and Preservation of Test Samples
The preparation method of cadmium selenide quantum dot nanocrystals can be found in
Appendix B.
The determination of UV-Vis absorption spectrum requires that the sub-dot sample to be
determined be evenly dispersed in a suitable solvent to form a clear and transparent sol
dispersion liquid. Cadmium selenide quantum dot nanocrystals must be modified with specific
surfactant molecules before they can be evenly dispersed in the corresponding solvent and used
as test samples for UV-Vis absorption spectrum detection. Cadmium selenide nanocrystals
prepared by the high-temperature oil phase pyrolysis have aliphatic hydrocarbon molecules on
the surface and can be dissolved in non-polar organic solvents, such as. n-hexane, toluene and
dichloroethane, etc.
Quantum dot test samples are placed in brown bottles and stored in an inert atmosphere, for
example, argon or nitrogen, and kept away from light.
7 Analysis Procedures
7.1 Sample Pre-treatment
Take a certain amount of quantum dot nanocrystal test sample, place it in a 5 mL volumetric
flask, add the same solvent as the sample dispersion medium and ultrasonically disperse it for
10 minutes, until the specimen becomes clear and transparent. Prepare a series of specimens
with different concentrations to measure the size and concentration of quantum dot samples.
NOTE 1.there is no agglomeration of the quantum dot sample in the determined specimen, that is,
the specimen is clear and transparent.
NOTE 2.select a suitable solvent, so that it has good dispersion capability for the quantum dot
sample, and the solvent itself has no absorption within the wavelength range of
determination.
7.2 Determination Conditions
It is recommended to adopt the following determination conditions.
a) Wavelength. 200 nm ~ 760 nm;
b) Scanning step size. 0.5 nm or 1 nm;
c) Slit width. 1 nm or 2 nm;
d) Temperature. room temperature (20 C ~ 25 C);
e) Reference solution. dispersion medium of quantum dot nanocrystal dispersion liquid;
f) Light source. hydrogen lamp (or deuterium lamp) and tungsten halogen lamp.
7.3 Determination Steps
Take two quartz or glass absorption cells that can be used in pairs and respectively use them for
the determination of the reference solution and the specimen dispersion liquid.
a) Respectively add 2/3 volume of the reference solution and the specimen dispersion
liquid to the two absorption cells;
b) Set parameters, such as. wavelength range, scanning speed and number of scans, etc.;
c) Firstly, perform a wavelength scan of the reference solution to establish the system
baseline;
d) Scan a series of specimen dispersion liquids in the same wavelength range. For the
specimen dispersion liquids with an absorbance between 0.2 and 0.8, it is more
suitable to adopt the Lambert-Beer’s Law to calculate the molar concentration;
e) Obtain the UV-Vis absorption spectral line of the determined specimen dispersion
liquids;
f) Follow the above-mentioned steps and conduct parallel determinations on the same
specimen.
By using an automatic recording UV-Vis spectrophotometer, the UV-Vis absorption spectral
line can be automatically scanned and drawn.
When using a non-automatic recording UV-Vis spectrophotometer, within the specified
wavelength range, every 5 nm ~ 10 nm, determine the absorbance once. When approaching the
band-edge absorption peak, the absorbance shall be determined every 1 nm ~ 2 nm. Take the
wavelength as the x-coordinate, and the corresponding absorbance as the y-coordinate to draw
the UV-Vis absorption spectral line.
NOTE. during the determination, use an absorption cell that is compatible with organic solvents
and cover it to prevent solvent evaporation.
8 Test Data Processing and Result Analysis
From the UV-Vis absorption spectral line, read the band-edge absorption peak and absorbance
of the specimen dispersion liquid.
With reference to the correspondence between the band-edge absorption peak and particle size
of cadmium selenide quantum dot nanocrystals in 4.3 and Appendix A, through the band-edge
absorption peak, determine the particle size of the cadmium selenide quantum dot sample in the
specimen, and the particle size distribution of the sample can be qualitatively determined by the
peak shape of the band-edge absorption peak in the UV-Vis absorption spectral line. With
reference to the correspondence between the molar absorption coefficient and the particle size
of the quantum dot sample in A.2, through the Lambert-Beer’s Law, the molar concentration of
the cadmium selenide quantum dot nanocrystal dispersion liquid can be calculated and
determined.
9 Test Report
The test report of the cadmium selenide quantum dot nanocrystal UV-Vis absorption spectrum
includes the following contents.
a) Test results.
1) UV-Vis absorption spectral line and band-edge characteristic peak of the
specimen;
2) Average particle size and particle size distribution of the sample;
3) Absorbance and molar concentration of the specimen;
4) Particle size distribution error and concentration error of the sample.
b) Determination specimen
1) Sample name;
2) Dispersion medium;
3) Ultrasonic power;
4) Ultrasonic time.
c) Instruments and equipment
1) Instrument model;
2) Determination conditions (absorption cell, wavelength range, scanning step size,
slit width and test temperature).
d) Other information
1) Test date;
2) Testing organization and tester.
The format of the test report issued can be found in Table C.1 in Appendix C.
Appendix B
(informative)
Synthesis of Cadmium Selenide Quantum Dot Nanocrystals by High-temperature Oil
Phase Pyrolysis Method
Cadmium selenide quantum dot nanocrystals can be synthesized by various chemical methods,
such as. high-temperature oil phase pyrolysis and aqueous phase synthesis, etc. At present, the
relatively mature method for preparing quantum dot nanocrystals with narrow particle size
distribution is the high-temperature oil phase pyrolysis method. The prepared quantum dots are
monocrystals and have good mono-dispersity.
B.1 Synthesis Scheme 1 (organic cadmium compound as cadmium source)
B.1.1 Raw materials and raw material pre-treatment
B.1.1.1 Raw materials. dimethylcadmium, selenium, TOP, Tri-n-octylphosphine, TOPO, Tri-n-
octylphophine oxide.
B.1.1.2 Raw material pre-treatment.
a) Before use, purify TOPO by reduced pressure distillation (vacuum degree = 133.33
Pa), and take the distillate with a distillation range of 260 C ~ 300 C;
b) Before use, use a 0.250 m microporous membrane to filter and purify
dimethylcadmium;
c) TOP and selenium can be directly used.
B.1.2 Synthesis steps
a) Add 50 g of dried TOPO into a reaction flask, evacuate (vacuum degree < 133.33 Pa),
raise the temperature to 200 C and maintain it for 20 minutes. During the constant
temperature process, intermittently use argon gas to bubble and exhaust air.
Afterwards, raise the temperature to and stabilize at 300 C. Under an argon
atmosphere, the reaction system pressure is 1.01325  105 Pa.
b) Preparation of reaction precursors.
Solution A. prepared by adding 1.00 mL (13.35 mmol) dimethylcadmium to 25.0 mL
of TOP;
Solution B. dissolve an appropriate amount of selenium in TOP to form TOPSe, then,
add 10 mL of 1.0 mol/L TOPSe to 15.0 mL of TOP;
After mixing Solution A and Solution B, transfer it to a 50 mL syringe.
c) Remove the heat source of the reaction system, then, rapidly add the reaction
precursor in b) to the vigorously stirred flask in a). The rapid introduction of the
reaction precursor causes the reaction solution to turn dark yellow / orange and have
characteristic absorption at 440 nm ~ 460 nm. Meanwhile, the temperature of the
reaction system rapidly drops to 180 C. Afterwards, the reaction system resumes
heating and gradually rises to 230 C ~ 260 C....
View full details