GB/T 20468-2006 English PDF (GBT20468-2006)
Regular price
$90.00 USD
Regular price
Sale price
$90.00 USD
Unit price
/
per
Delivery: 3 seconds. Download true-PDF + Invoice.
Get QUOTATION in 1-minute: Click GB/T 20468-2006
Historical versions: GB/T 20468-2006
Preview True-PDF (Reload/Scroll if blank)
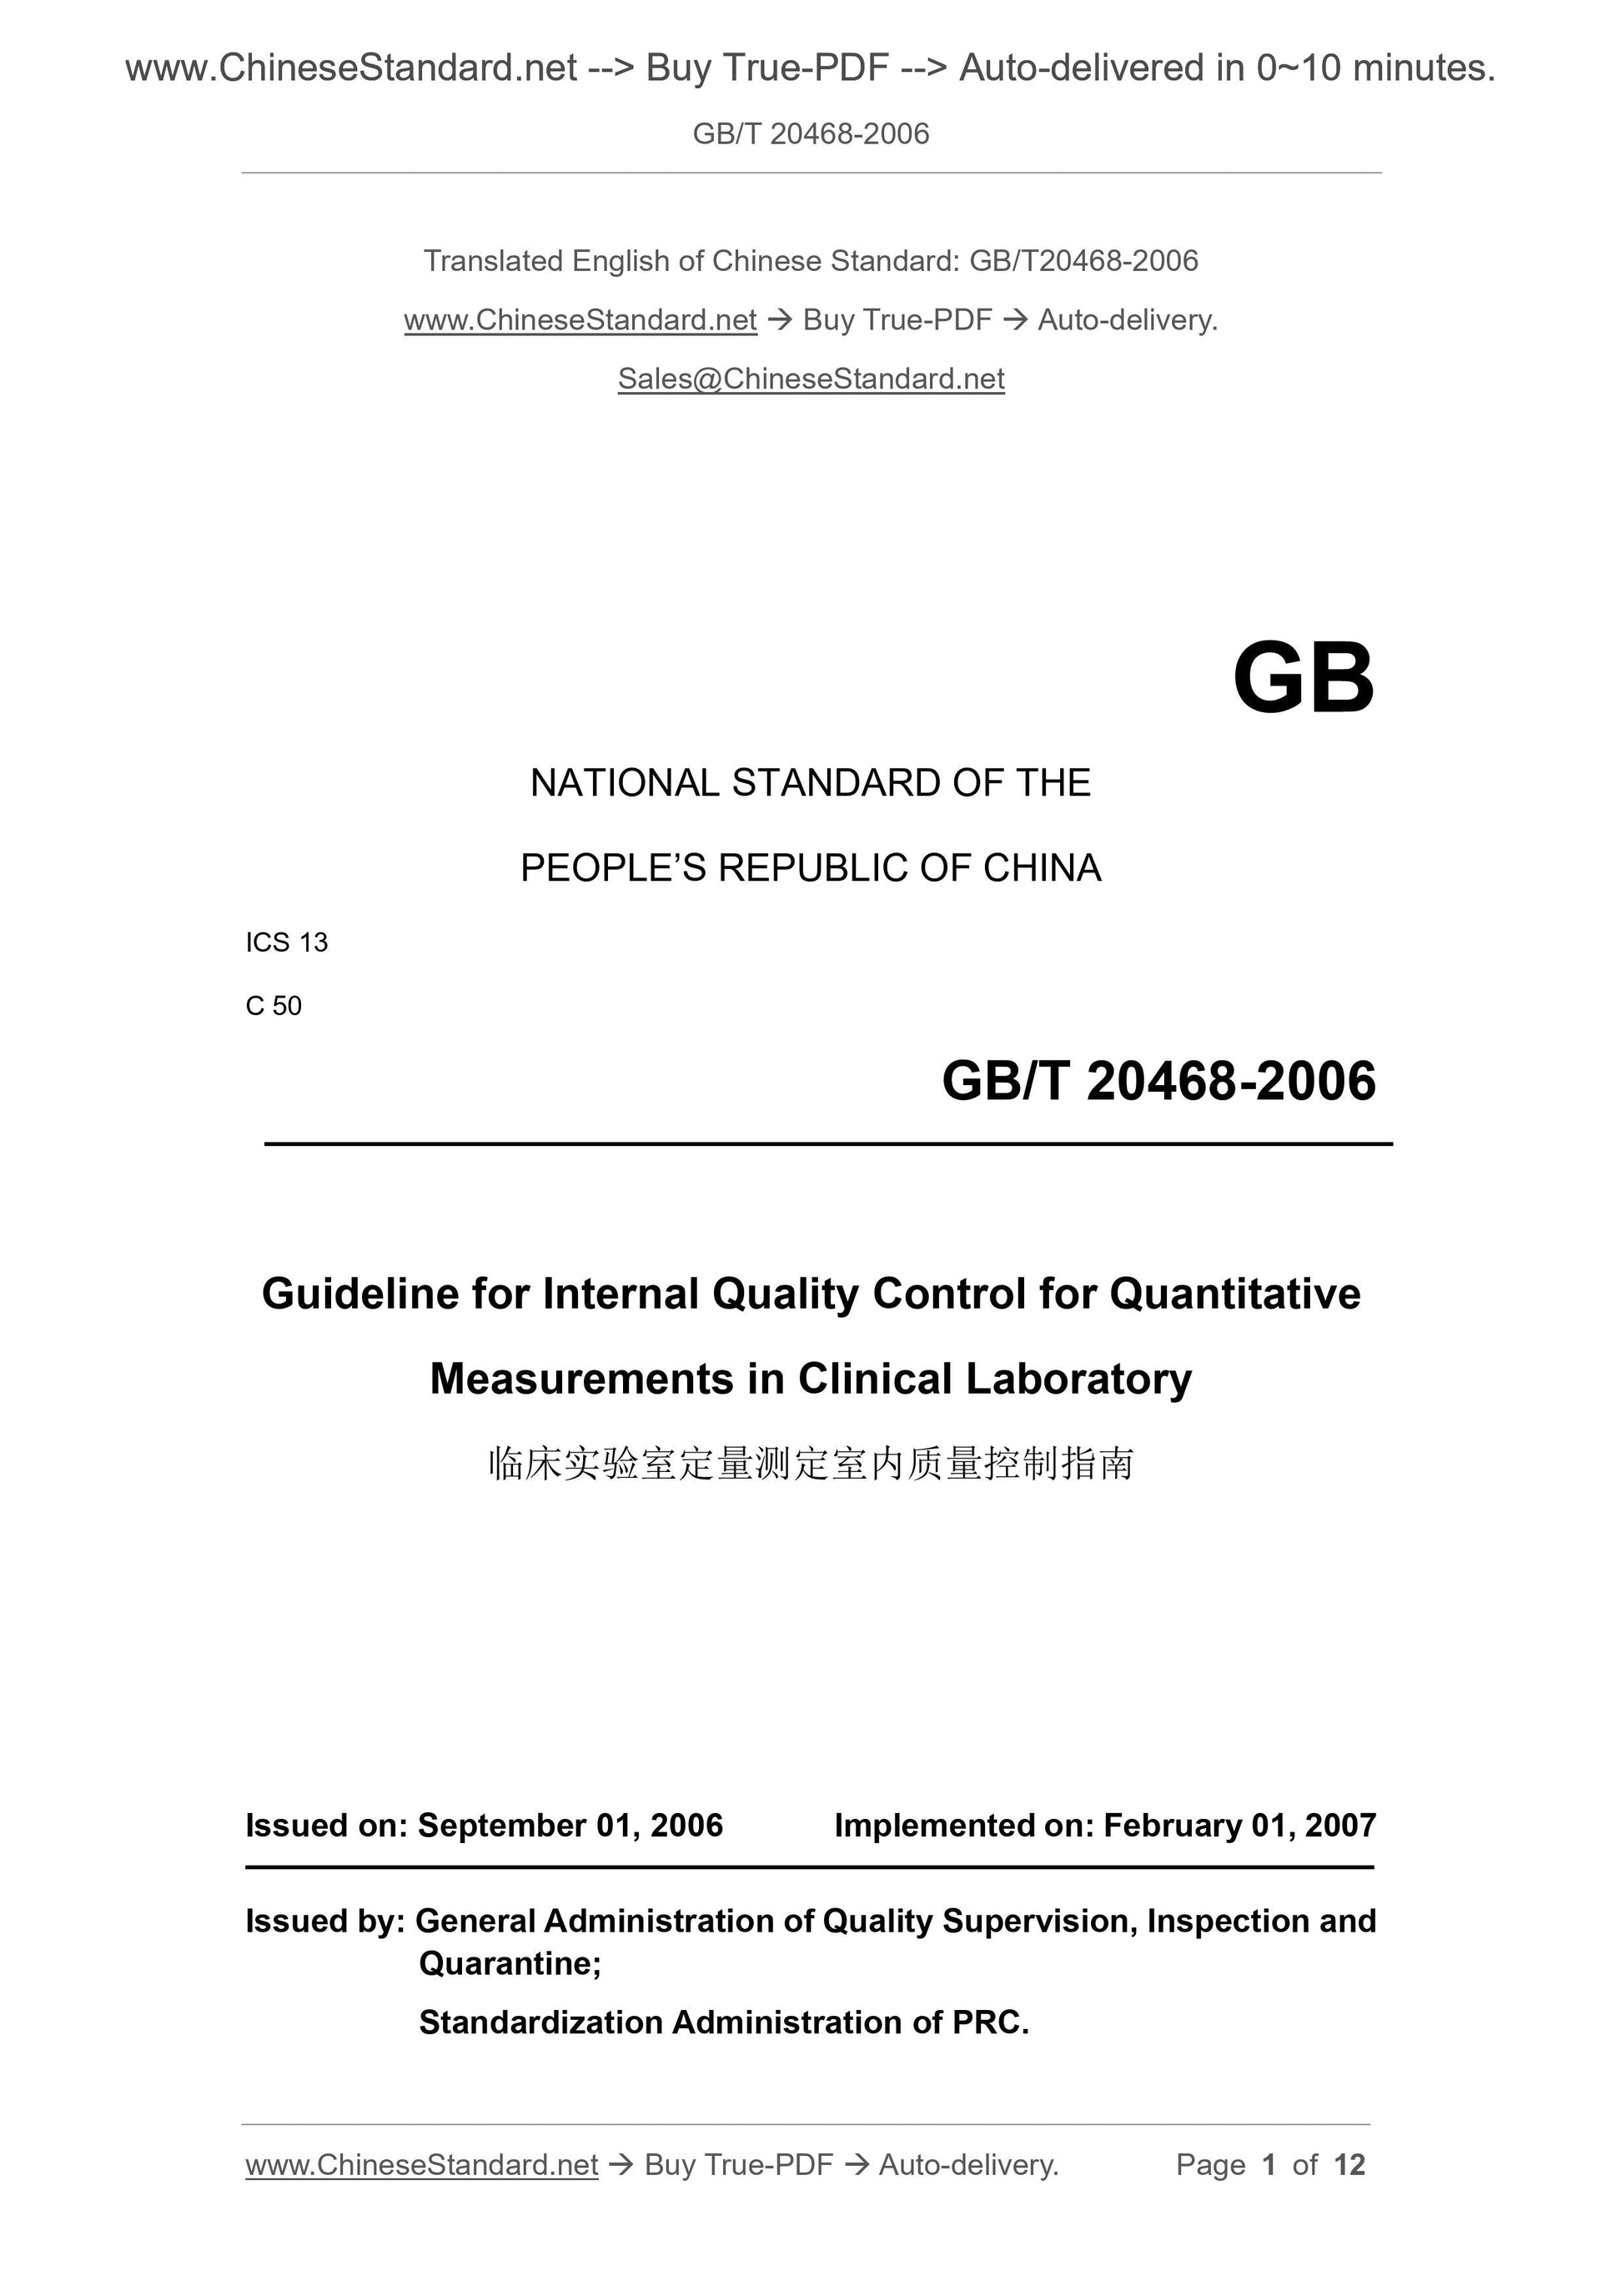
GB/T 20468-2006: General for internal quality control for quantitative measurements in clinical laboratory
GB/T 20468-2006
NATIONAL STANDARD OF THE
PEOPLE’S REPUBLIC OF CHINA
ICS 13
C 50
Guideline for Internal Quality Control for Quantitative
Measurements in Clinical Laboratory
ISSUED ON: SEPTEMBER 01, 2006
IMPLEMENTED ON: FEBRUARY 01, 2007
Issued by: General Administration of Quality Supervision, Inspection and
Quarantine;
Standardization Administration of PRC.
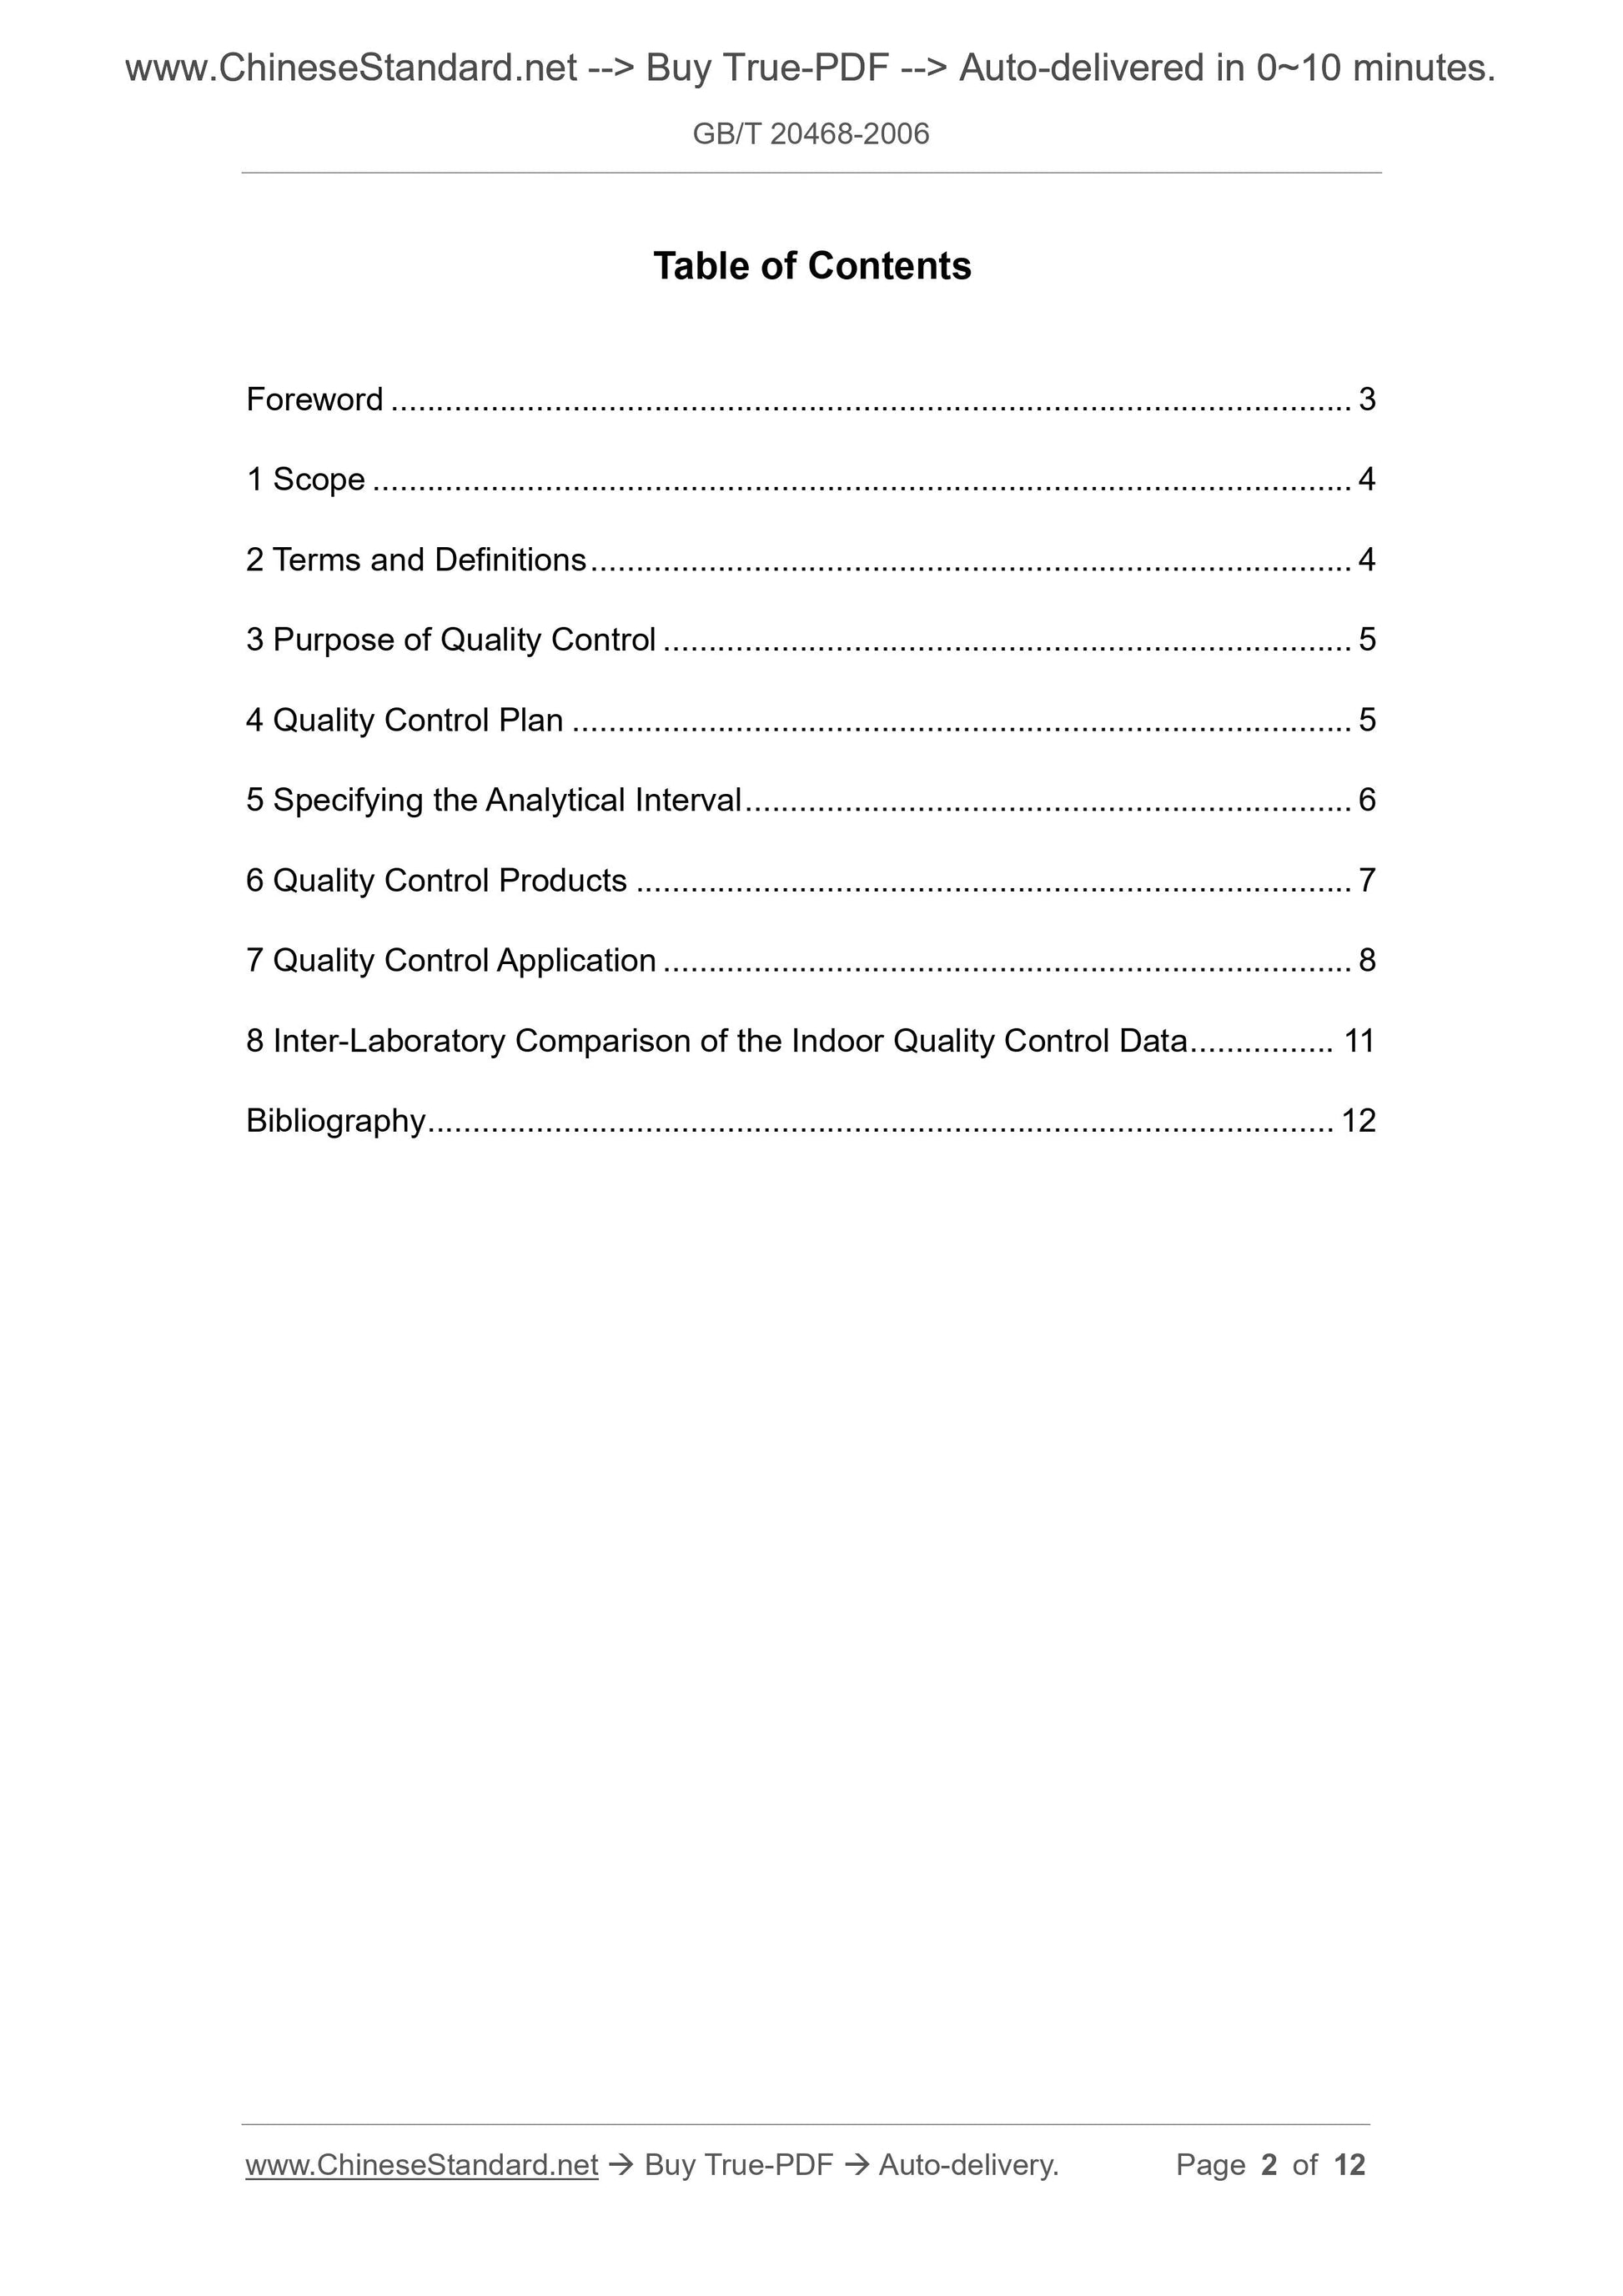
Table of Contents
Foreword ... 3
1 Scope ... 4
2 Terms and Definitions ... 4
3 Purpose of Quality Control ... 5
4 Quality Control Plan ... 5
5 Specifying the Analytical Interval ... 6
6 Quality Control Products ... 7
7 Quality Control Application ... 8
8 Inter-Laboratory Comparison of the Indoor Quality Control Data ... 11
Bibliography ... 12
Guideline for Internal Quality Control for Quantitative
Measurements in Clinical Laboratory
1 Scope
This Standard specifies the purpose, plan, analytical interval, quality control products,
quality control application, and inter-laboratory comparison of the indoor quality control
data for the internal quality control for quantitative measurements in clinical laboratory.
This Standard is applicable to the quantitative measurements in the clinical laboratory
of the medical and health institutions carrying out the clinical testing services.
2 Terms and Definitions
For the purpose of this Standard, the following terms and definitions apply.
2.1 Bias
The test results deviate from the system deviation with acceptable reference values
(with a positive or negative sign).
2.2 Imprecision
The random discrete for a set of repeated measurement results; its value are
expressed as standard deviation or coefficient of variation by the summary statistic
quantitative.
2.3 Quality control
Part of quality management is committed to meeting the quality requirements.
[GB/T 19000-2000, 3.2.10]
2.4 Quality control strategy
The principle for quality control varieties, frequency of each test, location of placement,
interpretation of quality control data, and determination of whether the analysis batch
is under or out of control.
2.5 Random error
4.2.1 Imprecision
The imprecision can be obtained by the repeated test against the quality control
products. The imprecisions can also be obtained by National Committee for Clinical
Laboratory Standardization (NCCLS) EP5-A.
4.2.2 Bias
In practice, the estimation of the bias can be obtained by determining difference
between value and inter-lab quality assessment/proficiency testing (PT).
4.3 Develop quality control strategy
It shall determine:
a) Test the types of the quality control products with different concentrations and the
number of each type;
b) Location of placement of quality control products;
c) Select the quality control principle.
4.4 Predicting the quality control performance
The indicator of the quality control performance are the probability of error detection
and probability of false rejection. According to the power function graph, the probability
of error detection and probability of false reject of different quality control rules at
different number of quality control test results can be predicted.
4.5 Setting the quality control performance
According to the multiple characteristics of the predicted different quality control rules,
combined with the clinical requirements and the actual situation of the inspection work,
the appropriate probability of error detection and probability of false rejection can be
selected.
4.6 Choosing the appropriate quality control rules
Based on the power function graph, critical error map and operational process
specification map, select the appropriate quality control rules and the number of quality
control products. Refer to literature [1] and [2] for the specific methods.
5 Specifying the Analytical Interval
5.1 Analytical run
the clinically meaningful concentration range.
7 Quality Control Application
7.1 Quality control strategy
The laboratory shall specify:
a) The type of the used quality control products with different concentrations;
b) The number of times each quality control product is tested;
c) Location of the quality control products;
d) The judgment rules to determine whether the analytical results are acceptable.
7.2 Testing frequency of the quality control products
At least one test shall be performed against the quality control products within the
length of the analytical run. Manufacturers of the analytical system and reagents shall
recommend the number and placement of the quality control products used for each
analytical run. The user, according to different conditions, can increase or decrease
the testing number of the quality control products or change their placement.
7.3 Location of the quality control products
The user shall determine the location of the quality control products within each run.
The principle is to evaluate the quality control results before reporting a batch of patient
test results. The location of the quality control products shall consider the types of the
analytical methods, it may generate the error types. For instance, in the user’s defined
run length (UDRL), if performing the non-continuous sample testing, then the quality
control products shall be placed before the end of the specimen inspection, the bias
can be detected. If the quality control products are evenly distributed through the whole
run, the drift can be monitored. If it is randomly inserted into the patient specimen, the
random error can be detected. Under any case, the quality control results shall be
evaluated before the patient test results are reported.
NOTE: In the routine work, the quality control products are placed behind the calibrator; the
obtained quality control results are the unrealistic estimate against the analysis imprecision; for
which the bias and drift, when the batch specimens are tested, can’t be estimated.
7.4 Quality control rules
7.4.1 Expression of quality control rules
Use AL to express the quality control rules; thereof, A represents the number of quality
7.6.1 Average value and standard deviation
The quality control limit is calculated by the average value and standard deviation,
which indicate that the analytical method used in the laboratory has variation for the
analysis of certain quality control products. For instance, the quality control limit for 13s
quality control rule is average value plus or minus 3 standard deviations.
The average value and standard deviation of the quality control products shall be
based on the repeated tests of the quality control products by routine laboratory
methods.
7.6.2 Fixed-value quality control products
If using the fixed-value quality control products, the original calibration value in the
instruction manual can only be used as a reference. The actual average value and
standard deviation shall be determined by the repeated tests in the laboratory.
7.6.3 Establishment of the average value of the new batch of quality control
products
Each item of the new batch of quality control products shall be tested in parallel with
the current quality control products; preferably at least 20 bottles shall be tested in
different days. If it is not possible to get 20 values within 20 days; then get it, at least
within 5 days, from the 4 times repeated tests every day.
7.6.4 Establishment of the standard deviation of the new batch of quality control
products
If the operation is stable for a long perio...