www.ChineseStandard.us -- Field Test Asia Pte. Ltd.
Regular price
$325.00
Regular price
Sale price
$325.00
Unit price
/
per
Sale
Sold out
Couldn't load pickup availability
Refresh
GB/T 24370-2021: Nanotechnologies - Characterization of cadmium chalcogenide colloidal quantum dot - UV-Vis absorption spectroscopy Delivery: 9 seconds. Download (and Email) true-PDF + Invoice.
Get Quotation: Click
GB/T 24370-2021 (Self-service in 1-minute)
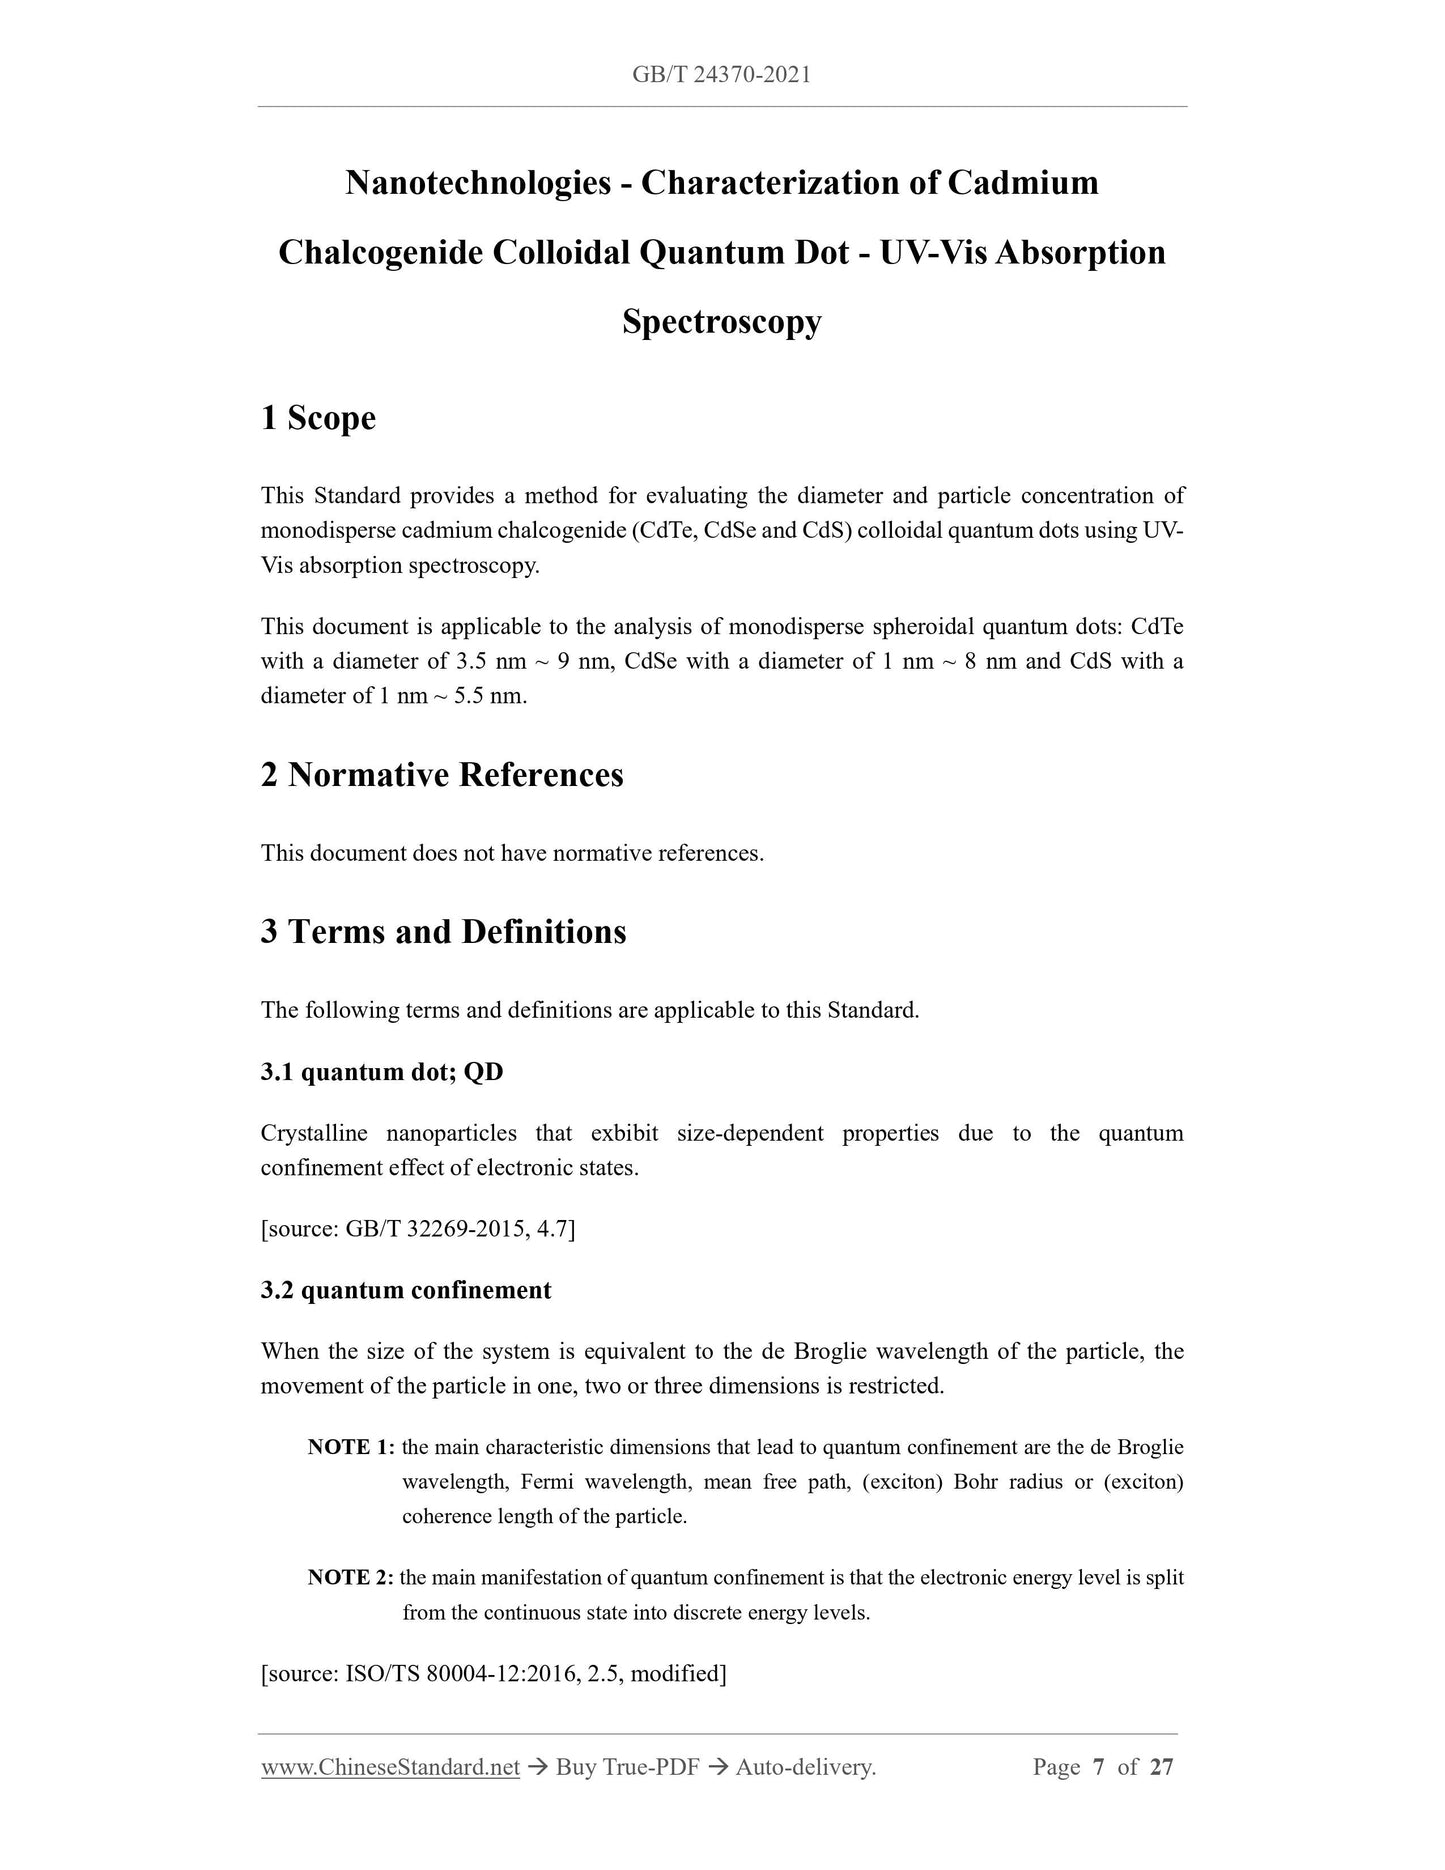
Newer / historical versions: GB/T 24370-2021 Preview True-PDF Scope This Standard provides a method for evaluating the diameter and particle concentration of
monodisperse cadmium chalcogenide (CdTe, CdSe and CdS) colloidal quantum dots using UV-
Vis absorption spectroscopy.
Basic Data Standard ID GB/T 24370-2021 (GB/T24370-2021)
Description (Translated English) Nanotechnologies - Characterization of cadmium chalcogenide colloidal quantum dot - UV-Vis absorption spectroscopy
Sector / Industry National Standard (Recommended)
Classification of Chinese Standard G30
Word Count Estimation 22,251
Issuing agency(ies) State Administration for Market Regulation, China National Standardization Administration
View full details